
A Principled Technologies report: Hands-on testing. Real-world results.

Improving energy efficiency in the data center: Endure higher temperatures with confidence with Dell PowerEdge HS5620 servers
In high-temperature test scenarios, a Dell PowerEdge HS5620 server continued running an intensive workload without component warnings or failures, while a Supermicro SYS-621C-TN12R server failed
Running a data center at higher temperatures can help organizations save on cooling costs and energy consumption. ENERGY STAR® notes that such measures can be financially beneficial: “Every 1°F increase in temperature can save 4% to 5% in energy costs.”1 But a data center can only remain as warm as its hardware will allow. Servers that can withstand higher day-to-day temperatures can help organizations meet sustainability goals. With the right thermal design, a server can also continue functioning at even hotter temperatures in the event of unexpected circumstances, such as internal fan failures or external environment malfunctions.
At PT, we tested two 2U cloud-optimized servers: the Dell™ PowerEdge™ HS5620 and the Supermicro® SYS-621C-TN12R. To create an environment where we could fully control and measure the temperature, we constructed an enclosure around a fully populated server rack. All the servers in the rack ran an intensive synthetic floating-point workload similar to a machine learning inference workload, which stressed the systems’ processors and generated heat in the environment.
We monitored the Dell and Supermicro servers’ internal temperatures during three types of scenario-based tests: ambient temperatures of 25°C, a fan failure, and a data center HVAC malfunction. The Dell system performed without component heat warnings or failures in these tests. In contrast, the Supermicro system yielded warnings in all scenarios and component failures in the second and third scenarios, resulting in system downtime that required manual intervention. Equipped with compelling cooling design advantages, the Dell PowerEdge HS5620 handled each challenge without fail.
How we tested
Table 1 shows key configuration information for the two cloud-optimized servers we tested. See the science behind the report for more details.
| Dell PowerEdge HS5620 | Supermicro SYS-621C-TN12R | |
|---|---|---|
| Processors | 2x Intel® Xeon® Gold 6444Y processors | 2x Intel Xeon Gold 6444Y processors |
| Memory | 1,024 GB of DDR5 RAM | 1,024 GB of DDR5 RAM |
| Network interface card (NIC) | Intel E810-XXV with 2x 25GbE ports | Intel E810-XXVAM2 (AOC-S25GC-i2S) with 2x 25GbE ports |
| Storage | 2x M.2 NVMe® SSDs | 2x M.2 NVMe SSDs |
| Storage controller | Dell BOSS N1 | Direct-attached PCIe® storage |
| Power supply unit (PSU) | 2x 1,800W Dell 05222NA00 | 2x 1,200W Supermicro HMCG94MEBRA123N |
| Fans | 5x Dell HPR Silver 1x Dell HPR Gold | 3x Supermicro Middle Fan FAN-0206L4 |
| OS | Ubuntu 22.04.3 | Ubuntu 22.04.3 |
We configured the Dell server with a storage controller and two M.2 NVMe drives to match the storage configuration of the Supermicro server. The Dell server configuration featured five Dell HPR Silver fans and one Dell HPR Gold fan. The Supermicro server supported three 8cm fans, the maximum number it could accommodate at the time of testing. To enable performance monitoring, we adjusted the BIOS system profile settings on the Dell server to “Performance Per Watt (OS).” We kept the Supermicro server’s default BIOS configuration, “OS Controls EPB,” as this setting allowed us monitor the data our tests required.
To create an environment for which we could control and measure the temperature, we built a custom enclosure around a fully loaded 42U server rack. We placed the Dell PowerEdge HS5620 and the Supermicro SYS-621C-TN12R in middle of the rack at the same position when we tested them. We configured the rest of the 42U rack with a top-of-rack switch and a variety of 2U and 1U servers, as well as blade servers and chassis, which generated heat while running their workloads. We captured baseband management and OS-level telemetry for component monitoring with third-party tools Telegraf™ and Prometheus.
We tested the servers in three types of scenarios: typical operations in 25°C ambient conditions, an internal fan failure (twice, with different fans disabled each time), and an HVAC malfunction where ambient temperatures rose to 35°C. In each of these scenarios, we used the stress-ng tool to stress the processors’ floating-point capabilities. This type of workload is critical for use cases including AI training and high-performance computing (HPC); for more information, see below. The cabinet of servers launched the workload in four waves, with the Dell and Supermicro systems we tested launching the workload in the fourth wave, 3 minutes and 30 seconds after the first servers began. We monitored temperatures and hardware statistics for 15 minutes prior to starting a workload, throughout the two-hour workload, and for 15 minutes after the workload completed.
For more details on our tests, results, and configurations, see the science behind the report.
Overview of our findings
In Tables 2 and 3, we show an overview of how various components of the servers fared during each test. If at least one of the listed component types showed a warning or failure, we note that below. As Table 2 shows, the components of the Dell PowerEdge HS5620 remained operational in each scenario type without displaying any warnings. On the other hand, the Supermicro SYS-621C-TN12R experienced at least one warning in each scenario type—including in 25°C ambient temperatures—as well as component failure in the HVAC malfunction scenario and in both fan failure scenarios (Table 3). The OS SSD failures we observed in testing resulted in system failure, rendering the Supermicro system unusable and requiring manual intervention. We analyze the servers’ thermal designs and examine these results more closely below.
| Dell PowerEdge HS5620 | ||||
|---|---|---|---|---|
| Component category | 25°C ambient temperatures | Fan 2 failure | Fan 3 failure | HVAC malfunction |
| CPU | No warnings or failures | No warnings or failures | No warnings or failures | No warnings or failures |
| RAM | No warnings or failures | No warnings or failures | No warnings or failures | No warnings or failures |
| NIC | No warnings or failures | No warnings or failures | No warnings or failures | No warnings or failures |
| M.2 SSD | No warnings or failures | No warnings or failures | No warnings or failures | No warnings or failures |
| PSU | No warnings or failures | No warnings or failures | No warnings or failures | No warnings or failures |
| Supermicro SYS-621C-TN12R | ||||
|---|---|---|---|---|
| Component category | 25°C ambient temperatures | Fan 1 failure | Fan 3 failure | HVAC malfunction |
| CPU | No warnings or failures | Warning | Warning | Warning |
| RAM | No warnings or failures | Warning | No warnings or failures | No warnings or failures |
| NIC | No warnings or failures | Warning | No warnings or failures | Warning |
| M.2 SSD | Warning | Failure | Warning | Failure |
| PSU | No warnings or failures | No warnings or failures | Failure | No warnings or failures |
System cooling design analysis: A closer look at the advantages of the Dell PowerEdge HS5620
Analyzing the systems’ thermal designs is key to understanding how they performed in each test scenario. Servers utilize several design elements to keep systems cool, such as motherboard design. The placement of sensitive components on the motherboard can help protect these components from causing one another to overheat. Additionally, fans keep air flowing, while chassis design should also help protect components from hot air. Below, we examine these design elements in the Dell PowerEdge HS5620 and Supermicro SYS-621C-TN12R servers.
Motherboard design
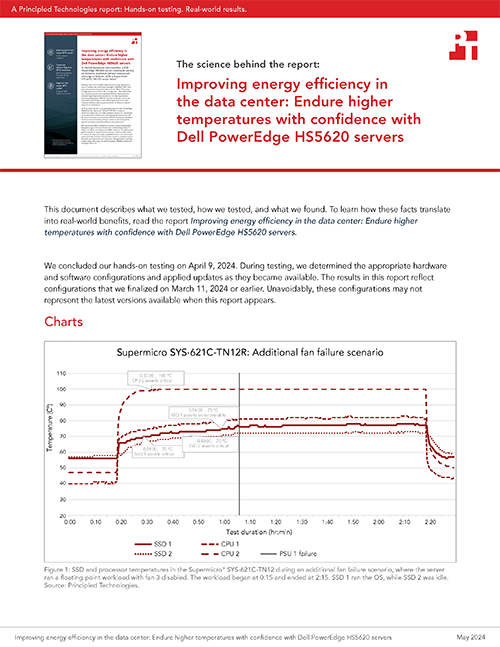
The Supermicro system’s motherboard layout was particularly problematic when it came to the placement of the M.2 NVMe modules. For example, in the second and third test scenarios, even the idle SSD’s temperature increased, as it was directly downstream from a processor under load. In addition, on the right side of the chassis, there was no dedicated fan feeding air into the power distribution module (PDU) that linked the twin PSUs to the rest of the system. Instead, the Supermicro system relied on airflow from the fans built into the PSUs at the back of the chassis. While we did not observe a failure of this PDU, the BMC reported a PSU failure during the second fan failure scenario, demonstrating the drawback of this design (see the science behind the report for more on this test). See Figure 1.
In contrast, the motherboard in the Dell PowerEdge HS5620 featured a more intricate design. Processor cooling modules used heat pipes on the heat sinks to allow for more effective cooling. The PDU was integrated onto the motherboard, allowing for smoother airflow over its components. In the configuration we tested, the PDU had both a Dell HPR Gold and Dell HPR Silver fan providing cooling to the components. As Figure 2 shows, openings in the Dell system’s air shroud allowed cool air to pass over the components, mitigating heat transfer from one component to another.


Fans
A system’s fans are a critical part of cooling design. The Dell PowerEdge HS5620 configuration we tested featured five 60mm Dell HPR Silver fans and one 60mm Dell HPR Gold fan. The Supermicro SYS-621C-TN12R we tested used three primary 80mm fans for cooling. In both servers, each of the power supplies had an additional dedicated fan built in.
Cubic feet per minute (CFM) is a rating that indicates how much air a fan can move. According to their labels, the six fans in the Dell system were 57.26 CFM each (343.56 CFM total), while the three fans in the Supermicro system were 104.7 CFM each2 (314.10 CFM total). Although these totals were close, CFM is only part of the story in a server. In our tests, we also found that the Supermicro SYS-621C-TN12R server’s fans ran at about 13,500 RPM at peak load. The Dell PowerEdge HS5620 server’s dual-rotor fans spun at around 20,000 RPM in our tests. These differences in speed and design allowed the Dell system’s fans to generate higher static pressure, meaning they pushed air through the system with greater force. This also means they counteracted backpressure in the hot aisle, which is critical to effective cooling,3 since equipment in the data center with stronger fans can overwhelm those with underpowered fans, leading to insufficient cooling.
Chassis design
The Supermicro SYS-621C-TN12R chassis included vents on both sides, between the fans and the storage backplane, which were not present in the Dell server. In theory, these vents might work to allow additional airflow into the chassis in an open-air server environment without cabinets or hot aisle containment. However, in practice, the design of data center cabinets means that the sides of a server chassis are within the same thermal zone as the hot aisle: Because server racks and cabinets allow for free airflow around the sides of the servers, those vents are not isolated. So, instead of expelling hot air or pulling in cold air, the vents could allow preheated air from behind the server stack to enter the chassis and circulate through the components, creating a heating loop. See Figure 3.

The Dell PowerEdge HS5620 continued without even a component warning; the Supermicro SYS-621C-TN12R failed in two scenarios
Scenario 1: 25°C ambient temperatures
To see how the servers performed under typical data center temperatures, we ran our first scenario. The American Society of Heating, Refrigerating and Air-Conditioning Engineers (ASHRAE) recommends keeping a typical data center at temperatures between 18°C and 27°C, though temperatures up to 45°C are acceptable for certain classes of equipment.4 In this scenario, we targeted an ambient temperature of 25°C in the test environment as we ran the workloads on the servers.
The Dell PowerEdge HS5620 did not display any component warnings or failures in this scenario. Its airflow design kept the thermal zones isolated, maintaining safe operating temperatures for all components. In contrast, 22 minutes into the test, the Supermicro system’s baseboard management controller (BMC) warned that the OS SSD reached a critical temperature. Then, 10 minutes later, it asserted the drive had reached a non-recoverable state, though the SSD did not fail in this scenario. This is because this BMC alert did not poll the component for failure—it simply indicated that the drive had crossed a threshold where failure may be imminent.
Over the course of the two-hour workload, the Dell server’s OS SSD averaged a temperature of 43.9°C, while the idle SSD averaged 45.5°C. The Supermicro system’s OS SSD averaged 77.5°C and the idle SSD averaged 61.7°C during the test—temperatures up to 33.6°C hotter than the Dell system. While the Dell server’s processors averaged 73.7°C and 70.7°C during the workload, the Supermicro server’s processors averaged 77.9°C and 71.1°C.
Figures 4 and 5 show the SSD and processor temperatures for the two systems over the course of the two-hour test. Figure 6 shows the servers’ power consumption, where increases in power correspond to the workload’s effect on the systems, including fans working to cool the servers.


In this scenario reflecting everyday operations in a 25°C data center, the Dell PowerEdge HS5620 performed without raising concerns, while the Supermicro SYS-621C-TN12R issued a critical warning for its OS drive. Table 4 summarizes the results of this test scenario.
| Scenario 1: 25°C ambient temperatures | ||
|---|---|---|
| Dell PowerEdge HS5620 | Supermicro SYS-621C-TN12 | |
| Outcome | No system failure | No system failure |
| Component failures | None | None |
| Component warnings | None | OS SSD |
| OS SSD average temperature | 43.9°C | 77.5°C |
| Idle SSD average temperature | 45.5°C | 61.7°C |
| Processor average temperatures |
73.7°C 70.7°C |
77.9°C 71.1°C |
Scenario 2: Fan failure
Even though careful monitoring and regular servicing can extend a server’s life, internal components can fail unexpectedly. In our second test scenario, we aimed to see how each server would perform with a fan failure.
In terms of equivalent airflow coverage of components, we determined fan 1 on the Supermicro server aligned best with fan 2 on the Dell system—we manually disabled these fans for our testing. We again started the test at an ambient temperature of 25°C and initiated the workload after 15 minutes of running the servers idle. Over the course of the two-hour test and for 15 minutes afterward, we monitored the systems for warnings and failures.
The Dell PowerEdge HS5620 did not experience any component failures or issue any component warnings, while the Supermicro SYS-621C-TN12R—with just two healthy fans—alerted us to high temperatures for the processors, RAM, and two NICs. The Supermicro system’s OS drive failed 1 hour and 49 minutes into the test, resulting in system failure; once the SSD cooled down and the OS could resume functioning, we had to restart the server via the BMC. The system’s air channels and fans were not able to compensate for cooling design shortcomings, such as airflow patterns that directed hot air from the processors and memory over the SSDs. In contrast, the Dell system’s greater number of fans—each spinning at a higher rate of rotations per minute (RPM) than those of the Supermicro system—and airflow design helped keep the system components cooler and functional.
We again found that the Dell system maintained lower temperatures, on average, over the course of the two-hour workload. Its OS SSD averaged 54.2°C, which was 28.0°C cooler than the Supermicro server’s OS SSD 82.2°C average. The Dell system’s idle SSD averaged 47.0°C, or 21.5°C cooler than the 68.5°C average of the Supermicro server’s idle SSD. When it came to average processor temperatures, those in the Dell server were 56.9°C and 44.3°C, while those in the Supermicro server ran much hotter, at 98.6°C and 72.8°C—a temperature difference of up to 54.3°C. We saw the Dell server’s management systems adjust performance when temperatures crossed safety thresholds based on whether the system detected cooling hardware failures or abnormal environmental conditions.
Figures 7 and 8 show the SSD and processor temperature measurements we collected. Figure 9 compares the systems’ power draw as the systems ran the workload, generating internal heat under load and compensating for the loss of the fan.


A server that can remain operational when a fan fails opens up time for an organization to implement a contingency procedure while IT admins service the system. But if a server’s OS drive or other critical component fails shortly after its fan does, important applications can go offline unexpectedly, interrupting users. Waiting on a replacement fan might keep the server down for even longer stretches of time. Table 5 summarizes our findings from this test scenario.
| Scenario 2: Fan failure | ||
|---|---|---|
| Dell PowerEdge HS5620 | Supermicro SYS-621C-TN12 | |
| Outcome | No system failure | System failure |
| Component failures | None | OS SSD |
| Component warnings | None | 1 SSD, 1 CPU, 1 memory module, 2 NICs |
| OS SSD average temperature | 54.2°C | 82.2°C |
| Idle SSD average temperature | 47.0°C | 68.5°C |
| Processor average temperatures |
56.9°C 44.3°C |
98.6°C 72.8°C |
We also ran a second fan failure scenario, where the fan we disabled in both servers was in a different position. For this scenario, we determined fan 3 in the Supermicro system was comparable to fan 3 in the Dell system. The Dell PowerEdge HS5620 once again did not experience any component warnings or failures, but the Supermicro SYS-621C-TN12R delivered warnings for the processors and SSDs, and one of its two PSUs failed. (For more details on this test, see the science behind the report.)
Scenario 3: HVAC malfunction
Unexpected failures aren’t limited to internal server components—overheating can also occur when something goes wrong with a facility. Our third scenario mirrors a data center whose cooling system malfunctions.
For 15 minutes, we verified each of the servers’ components were online and healthy in 25°C ambient temperatures. Then, we ran the workload for 15 minutes before shutting off all the air handlers in the test environment. When the ambient temperature in the environment reached 35°C—around one hour later—we turned the air handlers back on to reflect a situation where a facilities team fixes the HVAC system. We followed the servers’ cooling progress until the ambient temperature returned to 25°C.
According to documentation, the Dell PowerEdge HS5620 can run in 30°C conditions in the configuration we tested.5 In this scenario where temperatures rose to 35°C, the system worked past its limit and did not give any component-level warnings or experience any failures. We saw it adjust processor core speed and power consumption to avoid overheating in response to inlet sensor signals (see the science behind the report for more information). Although Supermicro SYS-621C-TN12R documentation states the system can operate in 35°C environments,6 it experienced OS SSD failure in this scenario, resulting in system failure. OS application telemetry stopped nearly an hour into the test. The system stopped responding to SSH and KVM commands, so we shut it down manually with the BMC. Notably, even during this downtime, the system continued to consume more power than the Dell PowerEdge HS5620 (Figure 12). The Supermicro system also gave high-temperature warnings on a NIC and a processor in this scenario.
Throughout the two-hour workload, the Dell system’s OS SSD averaged 48.0°C, and its idle SSD averaged 49.2°C. Compared to the Supermicro system’s average SSD temperatures—82.4°C for the OS drive and 66.4°C for the idle drive—the Dell system kept its SSDs up to 34.4°C cooler.
Figures 10 and 11 show the SSD and processor temperatures for the two systems during this scenario. Figure 12 compares the systems’ power consumption increases as they ran the workload.


In a situation where a data center’s HVAC system underperforms or fails, a server that continues to operate can minimize interruption to users and critical operations. Such a solution can also save time and effort for IT administrators: If a server gives warnings or fails due to overheating, an admin must spend extra time checking it, possibly even rebooting it manually. Table 6 shows a summary of our findings from this test scenario.
| Scenario 3: HVAC malfunction | ||
|---|---|---|
| Dell PowerEdge HS5620 | Supermicro SYS-621C-TN12 | |
| Outcome | No system failure | System failure |
| Component failures | None | OS SSD |
| Component warnings | None | 2 SSDs, 1 CPU, 1 NIC |
| OS SSD average temperature | 48.0°C | 82.4°C |
| Idle SSD average temperature | 49.2°C | 66.4°C |
| Processor average temperatures |
60.5°C 56.6°C |
89.0°C 80.8°C |
Conclusion: Remain resilient in high temperatures with the Dell PowerEdge HS5620 to help increase efficiency
Increasing your data center’s temperature can help your organization make strides in energy efficiency and cooling cost savings. With servers that can hold up to these higher everyday temperatures—as well as high temperatures due to unforeseen circumstances—your business can continue to deliver the performance your apps and clients require.
When we ran an intensive floating-point workload on a Dell PowerEdge HS5620 and a Supermicro SYS-621C-TN12R in three scenario types simulating typical operations at 25°C, a fan failure, and an HVAC malfunction, the Dell server experienced no component warnings or failures. In contrast, the Supermicro server experienced warnings in all three scenario types and experienced component failures in the latter two tests, rendering the system unusable. When we inspected and analyzed each system, we found that the Dell PowerEdge HS5620 server’s motherboard layout, fans, and chassis offered cooling design advantages.
For businesses aiming to meet sustainability goals by running hotter data centers, as well as those concerned with server cooling design, the Dell PowerEdge HS5620 is a strong contender to take on higher temperatures during day-to-day operations and unexpected malfunctions.
 Twitter
 Facebook
 LinkedIn
 Email
Email- ENERGY STAR, “5 Simple Ways to Avoid Energy Waste in Your Data Center,” accessed April 8, 2024, https://www.energystar.gov/products/data_center_equipment/5-simple-ways-avoid-energy-waste-your-data-center.
- Supermicro, “Supermicro 80mm Hot-Swappable Middle Fan (FAN-0206L4),” accessed April 9, 2024, https://store.supermicro.com/us_en/80mm-fan-0206l4.html.
- Electronics Cooling, “The Hidden Risk of Invisible Airflow Imbalance in an Efficient Contained Data Center,” accessed April 4, 2024, https://www.electronics-cooling.com/2016/07/the-hidden-risk-of-invisible-airflow-imbalance-in-an-efficient-contained-data-center/.
- ASHRAE TC9.9, “Data Center Power Equipment Thermal Guidelines and Best Practices,” accessed April 24, 2024, https://www.ashrae.org/file%20library/technical%20resources/bookstore/ashrae_tc0909_power_white_paper_22_june_2016_revised.pdf.
- Dell, “Dell PowerEdge HS5620 Technical Guide,” accessed May 8, 2024, https://www.delltechnologies.com/asset/en-us/products/servers/technical-support/poweredge-hs5620-technical-guide.pdf.
- Supermicro, “CloudDC SuperServer SYS-621C-TN12R,” accessed April 26, 2024, https://www.supermicro.com/en/products/system/datasheet/sys-621c-tn12r.
- Dell, “PowerEdge HS5620 Specification Sheet,” accessed April 1, 2024, https://www.delltechnologies.com/asset/en-us/products/servers/technical-support/poweredge-hs5620-spec-sheet.pdf.
- Dell, “PowerEdge HS5620 Specification Sheet.”
This project was commissioned by Dell Technologies.
May 2024
Principled Technologies is a registered trademark of Principled Technologies, Inc.
All other product names are the trademarks of their respective owners.
Principled Technologies disclaimer
Principled Technologies is a registered trademark of Principled Technologies, Inc.
All other product names are the trademarks of their respective owners.
DISCLAIMER OF WARRANTIES; LIMITATION OF LIABILITY:
Principled Technologies, Inc. has made reasonable efforts to ensure the accuracy and validity of its testing, however, Principled Technologies, Inc. specifically disclaims any warranty, expressed or implied, relating to the test results and analysis, their accuracy, completeness or quality, including any implied warranty of fitness for any particular purpose. All persons or entities relying on the results of any testing do so at their own risk, and agree that Principled Technologies, Inc., its employees and its subcontractors shall have no liability whatsoever from any claim of loss or damage on account of any alleged error or defect in any testing procedure or result.
In no event shall Principled Technologies, Inc. be liable for indirect, special, incidental, or consequential damages in connection with its testing, even if advised of the possibility of such damages. In no event shall Principled Technologies, Inc.’s liability, including for direct damages, exceed the amounts paid in connection with Principled Technologies, Inc.’s testing. Customer’s sole and exclusive remedies are as set forth herein.
Image close up


