XPRT white papers
Principled Technologies brings its technical expertise to the BenchmarkXPRT family with these informative white papers.
WebXPRT
-
Exploring WebXPRT 4
We discuss the differences between WebXPRT 4 and WebXPRT 3, the structure of the performance test workloads, the test’s scoring methodology, how to automate tests, and how to submit results for publication. Read
-
WebXPRT 4 results calculation
We explain how WebXPRT 4 calculates individual workload and overall scores. We also explain how we use confidence intervals and how they differ from variability. The white paper is accompanied by a spreadsheet that shows how the results are calculated from the benchmark’s raw timing information. Read
-
Exploring WebXPRT 3
We discuss the newest version of WebXPRT and describe its performance workloads in detail. In addition, we explain the test’s scoring methodology and provide a spreadsheet that shows how the benchmark converts raw timings into component and overall scores. Finally, we show how to automate the benchmark and submit test results. Read
-
WebXPRT 3 results calculation
We explain how WebXPRT 3 calculates individual workload and overall scores. We also explain how we use confidence intervals and how they differ from benchmark variability. The white paper is accompanied by a spreadsheet that shows exactly how the results are calculated from the benchmark’s raw timing information. Read
-
Exploring WebXPRT 2015
We discuss the structure of WebXPRT 2015, including the Web technologies and libraries WebXPRT uses, and give detailed descriptions of its component tests and workloads. In addition, we provide a spreadsheet that shows how the benchmark converts raw timings into component test and overall scores. Finally, we show how to automate the benchmark and how to submit test results. Read
-
WebXPRT 2013 results calculation and confidence interval
We explain what the WebXPRT confidence interval is. We also examine how the confidence interval differs from benchmark variability. Finally, we show how WebXPRT calculates its results. The white paper is accompanied by a spreadsheet that shows exactly how the results are calculated from the benchmark’s raw timing information. Read
CloudXPRT
-
Introduction to CloudXPRT
We describe CloudXPRT’s workloads, choosing and downloading installation packages, submitting CloudXPRT results for publication, and possibilities for future development. Read
-
Overview of the CloudXPRT Web Microservices Workload
We provide an overview of the CloudXPRT web microservices workload, including information about accessing the web microservices installation packages, the structure of the workload, its metrics, and test results. Read
-
Overview of the CloudXPRT Data Analytics Workload
We provide an overview of the CloudXPRT data analytics workload, including information about accessing the data analytics installation package, the structure of the workload, its metrics, and test results. Read
AIXPRT
-
Introduction to AIXPRT
We describe AIXPRT’s toolkits and workloads; how to adjust the key test parameters of batch size, the level of precision, the number of concurrent instances, and the default number of requests; how to use alternate test configuration files; how to understand and submit results, and how to access the source code. Read
MobileXPRT
-
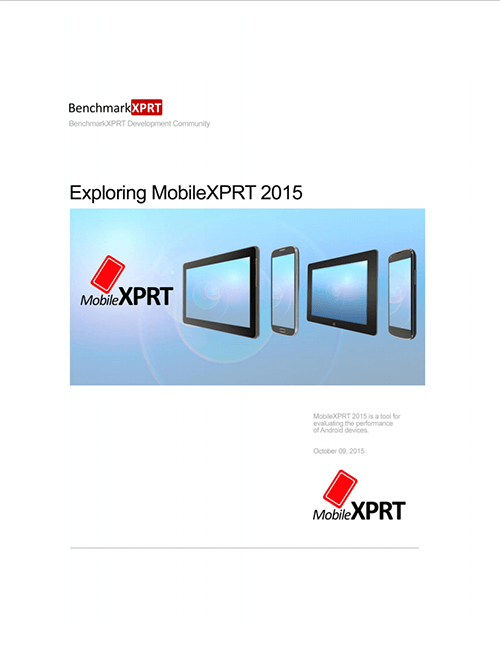
Exploring MobileXPRT 2015
We discuss the newest version of MobileXPRT, including its development process, new features, and details of the individual test workloads. We also explain exactly how the benchmark calculates results. Read
TouchXPRT
-
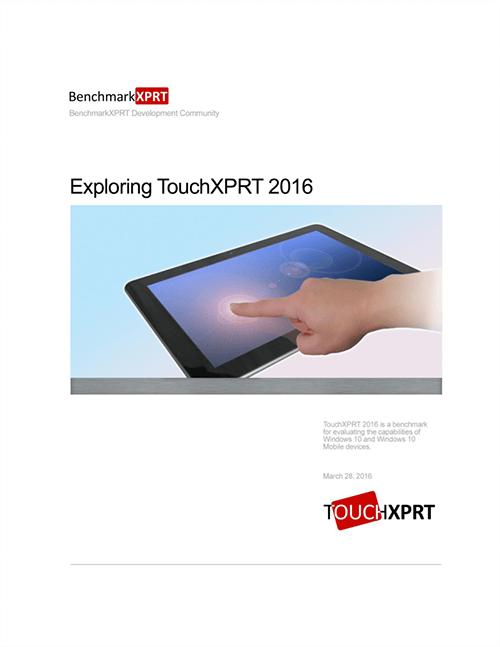
Exploring TouchXPRT 2016
We discuss the newest version of TouchXPRT, including its development process, descriptions of its component tests and workloads, and how the benchmark calculates individual workload and overall scores. The paper also shows how to submit test results and gives instructions for automated testing. Read
-
Exploring the TouchXPRT 2014 Benchmark
We discuss enhancements in the new version of TouchXPRT, including how we improved the UI, made the tests more demanding, and updated the content. We also describe the five component tests in detail, and show how we calculate individual component scores and the overall score. Read
BatteryXPRT
-
Exploring the BatteryXPRT 2014 for Android Benchmark
We discuss the guiding concepts behind BatteryXPRT 2014 for Android’s development, as well as the benchmark’s structure. We describe the component tests; explain the differences between the app’s Airplane, Wi-Fi, and Cellular modes; and detail the statistical processes used to calculate expected battery life. Read
CrXPRT
-
Exploring CrXPRT 2015
We discuss the concepts behind CrXPRT 2015, its development process, as well as the application’s structure. We also describe the component tests and detail the statistical processes used to calculate expected battery life. Read
HDXPRT
-
Exploring the HDXPRT 2014 Benchmark
We discuss the features of the newest version of HDXPRT, including its updated applications, smaller size, and much shorter install and runtime. We also describe the three test scenarios in detail and show how we calculate the results. Read
-
HDXPRT 2012 general benchmark
We explore general aspects of HDXPRT 2012 and how it measures the performance of target configurations. We describe the various usage categories and test scenarios implemented by the benchmark’s various workloads, and discuss in detail the scoring metrics and processes used. Read
-
HDXPRT 2012 Benchmark scaling
We investigate how changes in hardware configuration affect HDXPRT 2012 scoring. We report on actual testing Principled Technologies conducted with varying processor types, memory amounts, and drive types. Read
-
HDXPRT 2011 general benchmark
We explore general aspects of HDXPRT 2011 and how it measures the performance of target configurations. We describe the various usage categories and test scenarios implemented by the benchmark’s various workloads, and discuss in detail the scoring metrics and processes used. Read
-
HDXPRT 2011 benchmark scaling #1
This white paper is the first in a series where we investigate how changes in hardware configuration affect HDXPRT 2011 media creation scoring. We report on actual testing Principled Technologies conducted with varying processor types and clock frequencies, memory sizes, use of internal graphics versus external graphics cards, use of hard disk drives (HDDs) versus solid state drives (SSDs), and use of frequency boosting using Intel Turbo Boost Technology. Read
-
HDXPRT 2011 benchmark scaling #2
This white paper continues our previous HDXPRT 2011 scaling behavior paper. We further explore how graphics components affect HDXPRT 2011 scores with earlier processors. To do this, we configured an earlier generation Intel Core 2 Quad processor Q6600 with 4 GB of RAM, and tested HDXPRT 2011 on it with internal graphics and external ATI Radeon and NVIDIA graphics cards. The paper presents our test results and includes a comparison of how the graphics approach influences HDXPRT 2011 overall scores for both the Intel Core 2 Quad processor Q6600 and the 2nd-generation Intel Core i7-2600K processor. Read


