BenchmarkXPRT Blog banner

Tag Archives: test results

How to automate your WebXPRT 4 testing

We’re excited about the ongoing upward trend in the number of completed WebXPRT 4 runs that we’re seeing each month. OEM and tech press labs are responsible for a significant amount of that growth, and many of them use WebXPRT’s automation features to complete large blocks of hands-off testing at one time. We realize that many new WebXPRT users may be unfamiliar with the benchmark’s automation tools, so we decided to provide a quick guide to WebXPRT automation in today’s blog. Whether you’re testing one or 1,000 devices, the instructions below can help save you some time.

WebXPRT 4 allows users to run scripts in an automated fashion and control test execution by appending parameters and values to the WebXPRT URL. Three parameters are available:

  • test type
  • test scenarios
  • results

Below, you’ll find a description of those parameters and instructions for how you can use them to automate your test runs.

Test type

The WebXPRT automation framework accounts for two test types: (1) the six core workloads, and (2) any experimental workloads we might add in future builds. There are currently no experimental tests in WebXPRT 4, so always set the test type variable to 1.

  • Core tests: 1

Test scenario

The test scenario parameter lets you specify which subtest workloads to run by using the following codes:

  • Photo enhancement: 1
  • Organize album using AI: 2
  • Stock option pricing: 4
  • Encrypt notes and OCR scan using WASM: 8
  • Sales graphs: 16
  • Online homework: 32

To run a single subtest workload, use its code. To run multiple workloads, use the sum of their codes. For example, to run Stock options pricing (4) and Encrypt notes and OCR scan (8), use the sum of 12. To run all core tests, use 63, the sum of all the individual test codes (1 + 2 + 4 + 8 + 16 + 32 = 63).

Results format

The results format parameter lets you select the format of the results:

  • Display the result as an HTML table: 1
  • Display the result as XML: 2
  • Display the result as CSV: 3
  • Download the result as CSV: 4

To use the automation feature, start with the URL https://www.principledtechnologies.com/benchmarkxprt/webxprt/2021/wx4_build_3_7_3, append a question mark (?), and add the parameters and values separated by ampersands (&). For example, to run all the core tests and download the results, you would use the following URL: https://principledtechnologies.com/benchmarkxprt/webxprt/2021/wx4_build_3_7_3/auto.php?testtype=1&tests=63&result=4

We hope WebXPRT 4’s automation features will make testing easier for you. If you have any questions about WebXPRT or the automation process, please feel free to ask!

Justin

Best practices in benchmarking

From time to time, a tester writes to ask for help determining why they see different WebXPRT scores on two systems that have the same hardware configuration. The scores sometimes differ by a significant percentage. This can happen for many reasons, including different software stacks, but score variability can also result from different testing behavior and environments. While a small amount of variability is normal, these types of questions provide an opportunity to talk about the basic benchmarking practices we follow in the XPRT lab to produce the most consistent and reliable scores.

Below, we list a few basic best practices you might find useful in your testing. Most of them relate to evaluating browser performance with WebXPRT, but several of these practices apply to other benchmarks as well.

  • Test with clean images: We typically use an out-of-box (OOB) method for testing new devices in the XPRT lab. OOB testing means that other than running the initial OS and browser version updates that users are likely to run after first turning on the device, we change as little as possible before testing. We want to assess the performance that buyers are likely to see when they first purchase the device, before installing additional apps and utilities. This is the best way to provide an accurate assessment of the performance retail buyers will experience. While OOB is not appropriate for certain types of testing, the key is to not test a device that’s bogged down with programs that will influence results.
  • Turn off automatic updates: We do our best to eliminate or minimize app and system updates after initial setup. Some vendors are making it more difficult to turn off updates completely, but you should always double-check update settings before testing.
  • Get a baseline for system processes: Depending on the system and the OS, a significant amount of system-level activity can be going on in the background after you turn it on. As much as possible, we like to wait for a stable (idle) baseline of system activity before kicking off a test. If we start testing immediately after booting the system, we often see higher variance in the first run before the scores start to tighten up.
  • Hardware is not the only important factor: Most people know that different browsers produce different performance scores on the same system. However, testers aren’t always aware of shifts in performance between different versions of the same browser. While most updates don’t have a large impact on performance, a few updates have increased (or even decreased) browser performance by a significant amount. For this reason, it’s always worthwhile to record and disclose the extended browser version number for each test run. The same principle applies to any other relevant software.
  • Use more than one data point: Because of natural variance, our standard practice in the XPRT lab is to publish a score that represents the median from three to five runs, if not more. If you run a benchmark only once, and the score differs significantly from other published scores, your result could be an outlier that you would not see again under stable testing conditions.

We hope these tips will help make your testing more accurate. If you have any questions about the XPRTs, or about benchmarking in general, feel free to ask!

Justin

How to use the WebXPRT language options

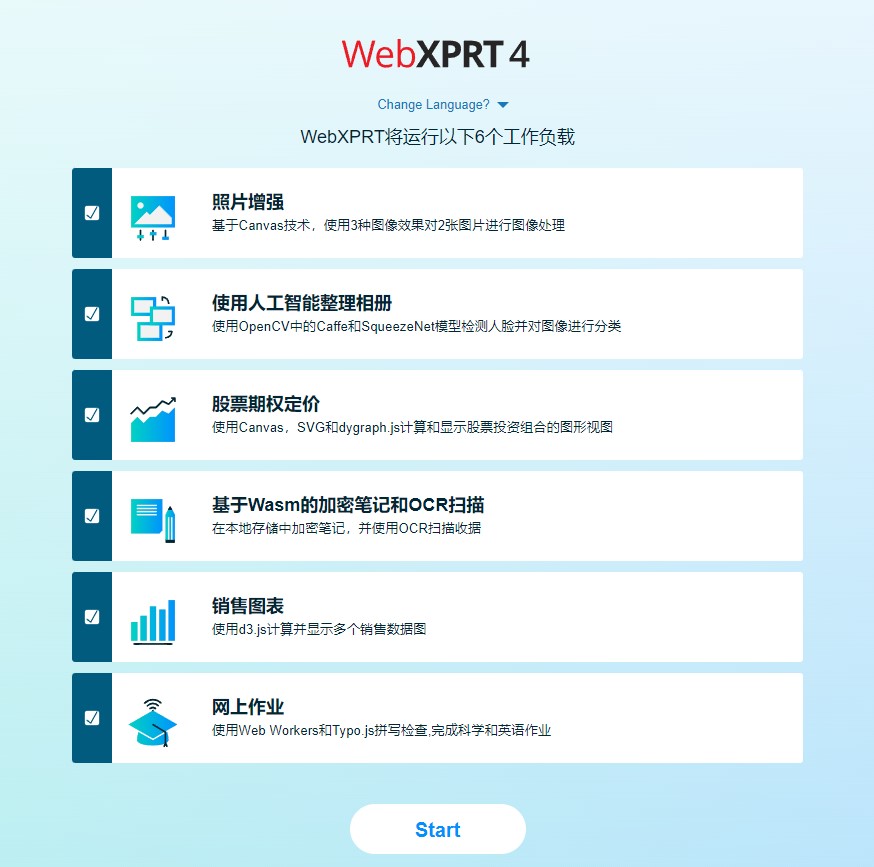
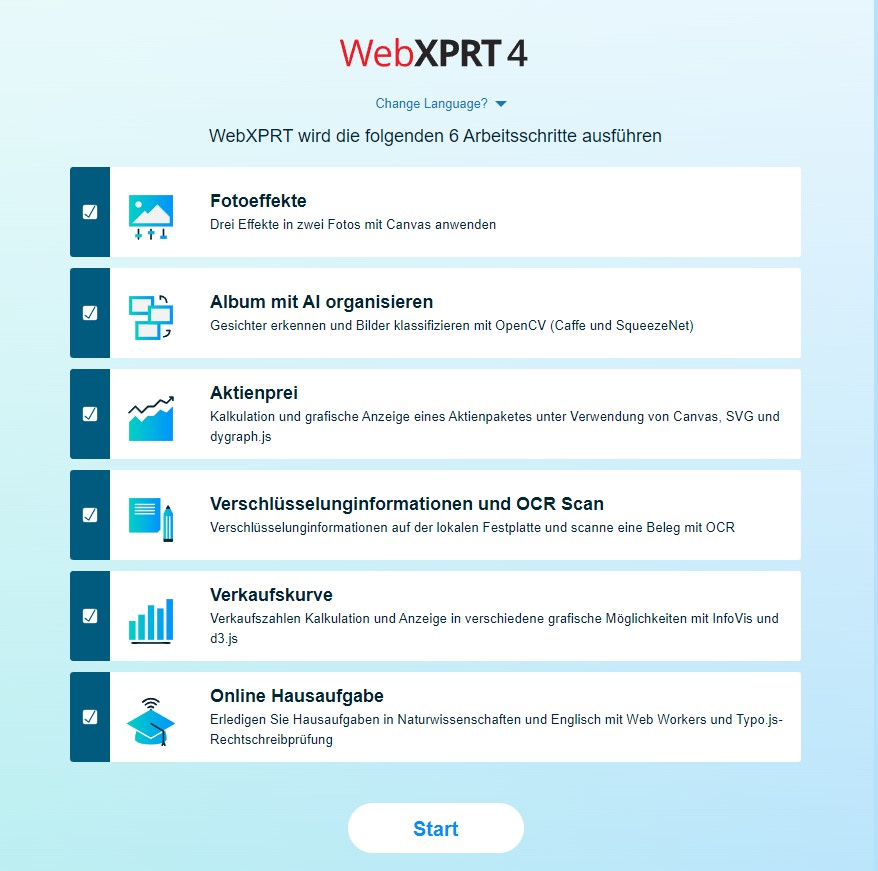
In September, the Chinese tech review site KoolCenter published a review of the ASUS Mini PC PN51 that included a screenshot of the device’s WebXPRT 4 test result screen. The screenshot showed that the testers had enabled the WebXPRT Simplified Chinese UI. Users can choose from three language options in the WebXPRT 4 UI: Simplified Chinese, German, and English. We included Simplified Chinese and German because of the large number of test runs we see from China and Central Europe. We wanted to make testing a little easier for users who prefer those languages, and are glad to see people using the feature.

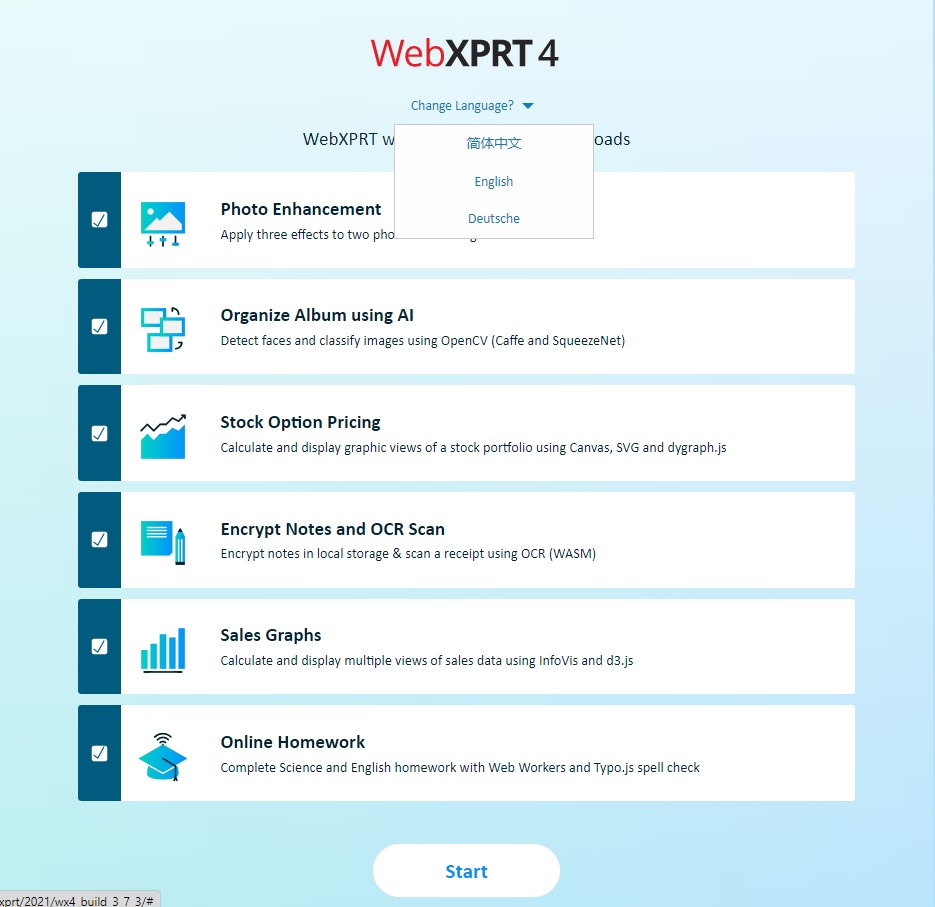
Changing languages in the UI is very straightforward. Locate the Change Language? prompt under the WebXPRT 4 logo at the top of the Start screen, and click or tap the arrow beside it. After the drop-down menu appears, select the language you want. The language of the start screen changes to the language you selected, and the in-test workload headers and the results screen also appear in your chosen language.

The screenshots below my sig show the Change Language? drop-down menu, and how the Start screen appears when you select Simplified Chinese or German. Be aware that if you have a translation extension installed in your browser, the extension may override the WebXPRT UI by reverting the language back to the default of English. You can avoid this conflict by temporarily disabling the translation extension for the duration of WebXPRT testing.

If you have any questions about WebXPRT’s language options, please let us know!

Justin

Our results database is your resource

Testers new to the XPRT benchmarks may not know about one of the free resources we offer. The XPRT results database currently holds more than 3,000 test results from over 120 sources, including major tech review publications around the world, OEMs, and independent testers. It offers a wealth of current and historical performance data across all the XPRT benchmarks and hundreds of devices.

We update the results database several times a week, adding selected results from our own internal lab testing, reliable tech media sources, and end-of-test user submissions. (After you run one of the XPRTs, you can choose to submit the results, but they don’t automatically appear in the database.) Before adding a result, we evaluate whether the score makes sense and is consistent with general expectations, which we can do only when we have sufficient system information details. For that reason, we ask testers to disclose as much hardware and software information as possible when publishing or submitting a result.

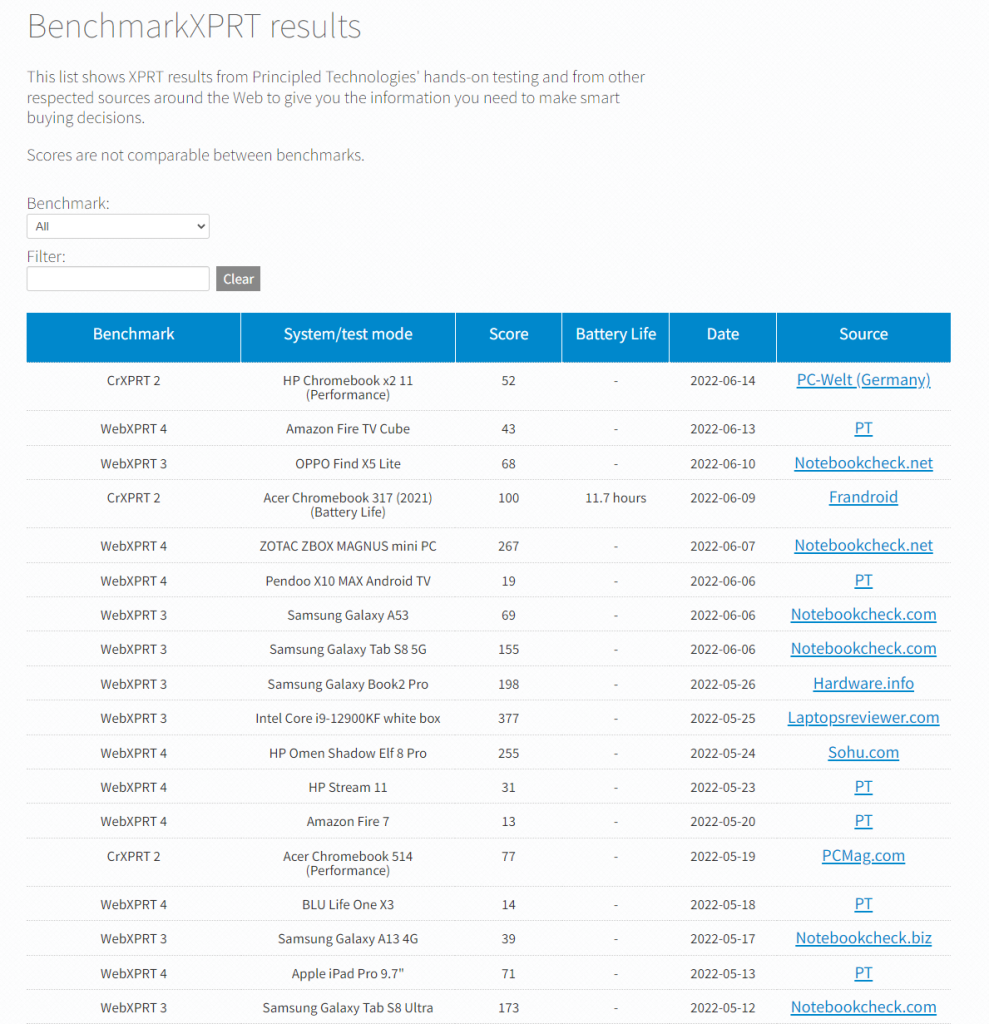
We encourage visitors to our site to explore the XPRT results database. There are three primary ways to do so. The first is by visiting the main BenchmarkXPRT results browser, which displays results entries for all of the XPRT benchmarks in chronological order (see the screenshot below). You can narrow the results by selecting a benchmark from the drop-down menu and can type values, such as vendor or the name of a tech publication, into the free-form filter field. For results we’ve produced in our lab, clicking “PT” in the Source column takes you to a page with additional disclosure information for the test system. For sources outside our lab, clicking the source name takes you to the original article or review that contains the result.

The second way to access our published results is by visiting the results page for an individual XPRT benchmark. Go the page of the benchmark that interests you, and look for the blue View Results button. Clicking it takes you to a page that displays results for only that benchmark. You can use the free-form filter on the page to filter those results, and can use the Benchmarks drop-down menu to jump to the other individual XPRT results pages.

The third way to view information in our results database is with the WebXPRT 4 results viewer. The viewer provides an information-packed, interactive environment in which users can explore data from the curated set of WebXPRT 4 results we’ve published on our site. To learn more about the viewer’s capabilities and features, check out this blog post from March.

We hope you’ll take some time to browse the information in our results database. We welcome your feedback about what you’d like to see in the future and suggestions for improvement. Our database contains the XPRT scores that we’ve gathered, but we publish them as a resource for you. Let us know what you think!

Justin

The WebXPRT 4 results viewer is live!

In October, we shared an early preview of the new results viewer tool that we’ve been developing in parallel with WebXPRT 4. The WebXPRT 4 Preview is now available to the public, and we’re excited to announce that the new results viewer is also live. We already have over 65 test results in the viewer, and in the weeks leading up to the WebXPRT 4 general release, we’ll be actively populating the viewer with the latest PT-curated WebXPRT 4 Preview results.

We encourage readers to visit the blog for details about the viewer’s features, and to take some time to explore the data. We’re excited about this new tool, which we view as an ongoing project with room for expansion and improvement based on user feedback.

If you have any questions or comments about the WebXPRT 4 Preview or the new results viewer, please feel free to contact us!

Justin

An early preview of the new WebXPRT 4 results viewer!

Last week, we shared some new details about the changes we’re likely to make in WebXPRT 4, and a rough target date for publishing a preview build. This week, we’re excited to share an early preview of the new results viewer tool that we plan to release in conjunction with WebXPRT 4. We hope the tool will help testers and analysts access the wealth of WebXPRT test results in our database in an efficient, productive, and enjoyable way. We’re still ironing out many of the details, so some aspects of what we’re showing today might change, but we’d like to give you an idea of what to expect.

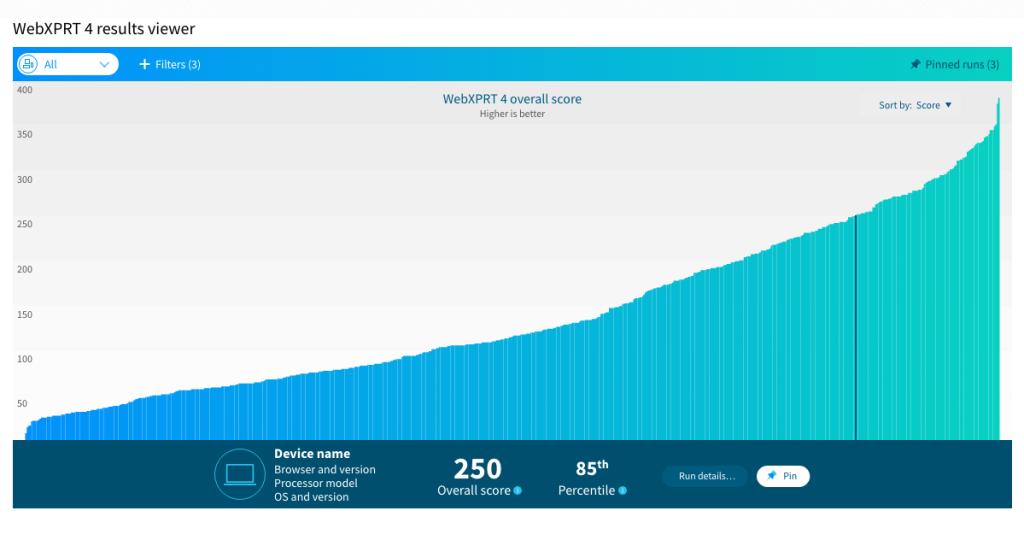
The screenshot below shows the tool’s default display. In this example, the viewer displays over 650 sample results—from a wide range of device types—that we’re currently using as placeholder data. The viewer will include several sorting and filtering options, such as device type, hardware specs such as browser type and processor vendor, the source of the result, etc.

Each vertical bar in the graph represents the overall score of single test result, and the graph presents the scores in order from lowest to highest. To view an individual result in detail, the user simply hovers over and selects the bar representing the result. The bar turns dark blue, and the dark blue banner at the bottom of the viewer displays details about that result.

In the example above, the banner shows the overall score (250) and the score’s percentile rank (85th) among the scores in the current display. In the final version of the viewer, the banner will also display the device name of the test system, along with basic hardware disclosure information. Selecting the Run details button will let users see more about the run’s individual workload scores.

We’re still working on a way for users to pin or save specific runs. This would let users easily find the results that interest them, or possibly select multiple runs for a side-by-side comparison.

We’re excited about this new tool, and we look forward to sharing more details here in the blog as we get closer to taking it live. If you have any questions or comments about the results viewer, please feel free to contact us!

Justin

Check out the other XPRTs:

Forgot your password?