Testers new to the XPRT benchmarks may not know about one of the free resources we offer. The XPRT results database currently holds more than 3,000 test results from over 120 sources, including major tech review publications around the world, OEMs, and independent testers. It offers a wealth of current and historical performance data across all the XPRT benchmarks and hundreds of devices.
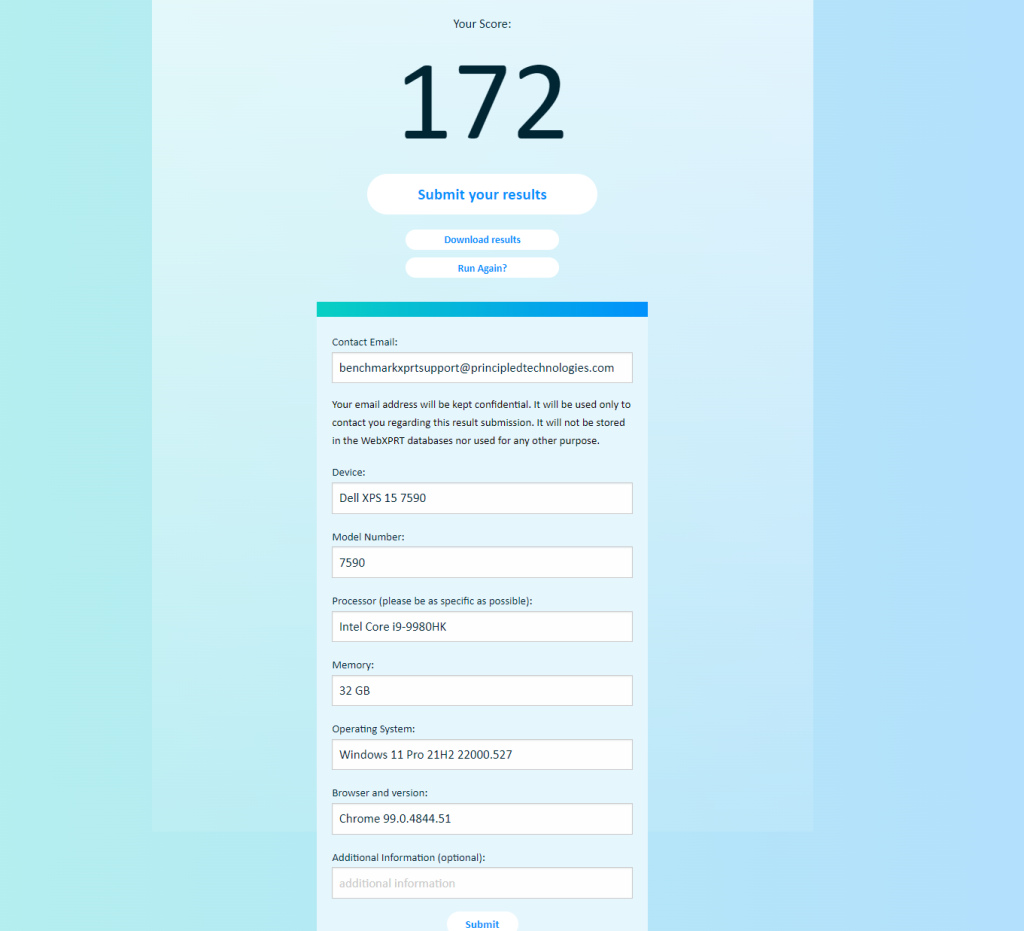
We update the results database several times a week, adding selected results from our own internal lab testing, reliable tech media sources, and end-of-test user submissions. (After you run one of the XPRTs, you can choose to submit the results, but they don’t automatically appear in the database.) Before adding a result, we evaluate whether the score makes sense and is consistent with general expectations, which we can do only when we have sufficient system information details. For that reason, we ask testers to disclose as much hardware and software information as possible when publishing or submitting a result.
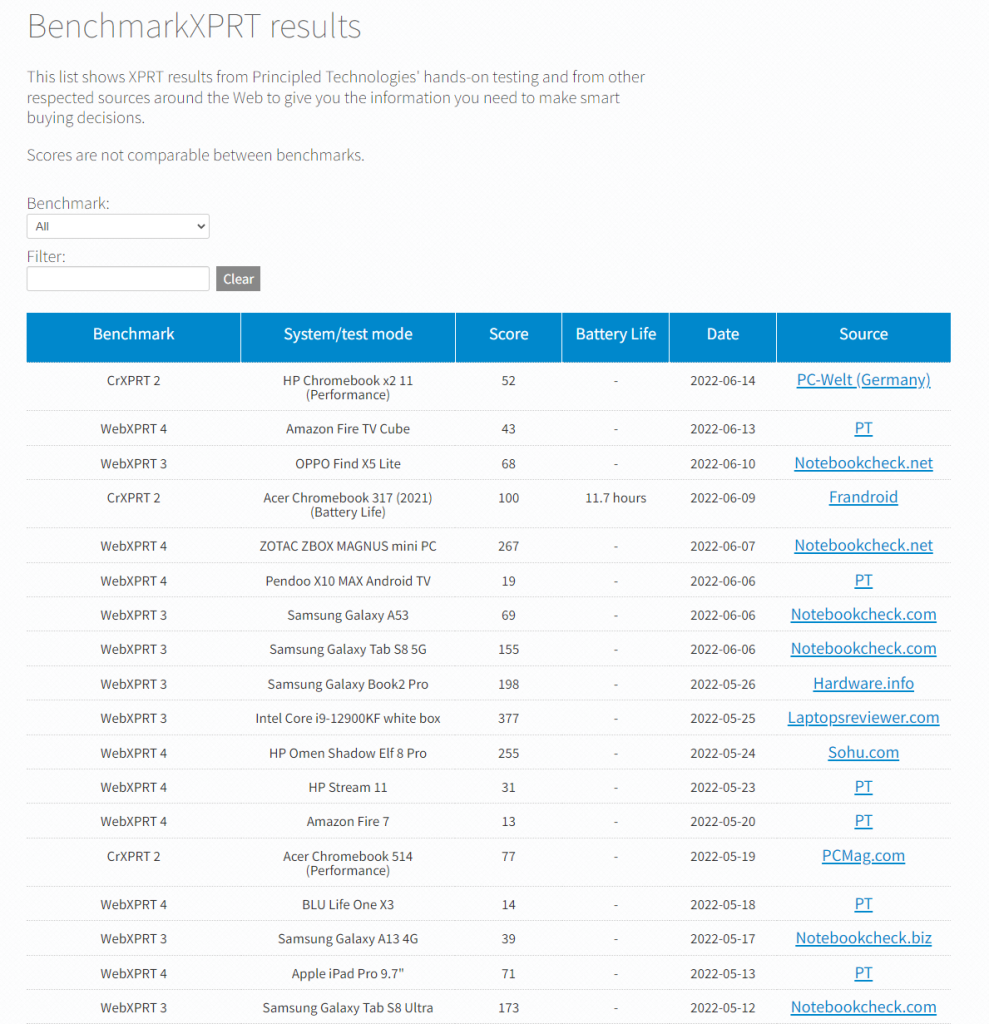
We encourage visitors to our site to explore the XPRT results database. There are three primary ways to do so. The first is by visiting the main BenchmarkXPRT results browser, which displays results entries for all of the XPRT benchmarks in chronological order (see the screenshot below). You can narrow the results by selecting a benchmark from the drop-down menu and can type values, such as vendor or the name of a tech publication, into the free-form filter field. For results we’ve produced in our lab, clicking “PT” in the Source column takes you to a page with additional disclosure information for the test system. For sources outside our lab, clicking the source name takes you to the original article or review that contains the result.
The second way to access our published results is by visiting the results page for an individual XPRT benchmark. Go the page of the benchmark that interests you, and look for the blue View Results button. Clicking it takes you to a page that displays results for only that benchmark. You can use the free-form filter on the page to filter those results, and can use the Benchmarks drop-down menu to jump to the other individual XPRT results pages.
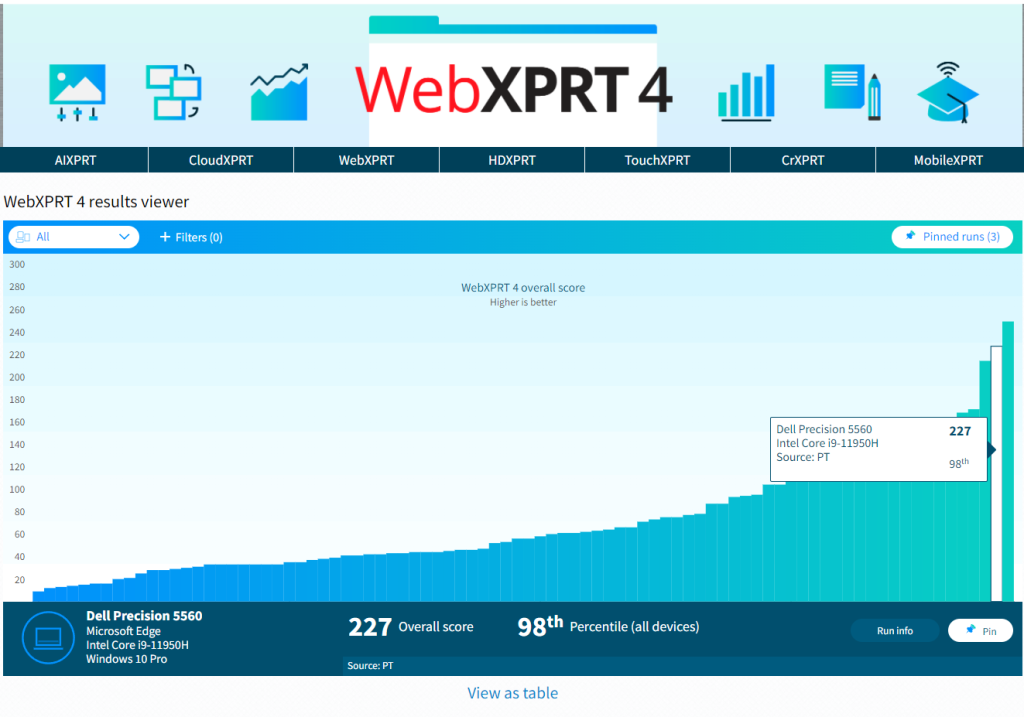
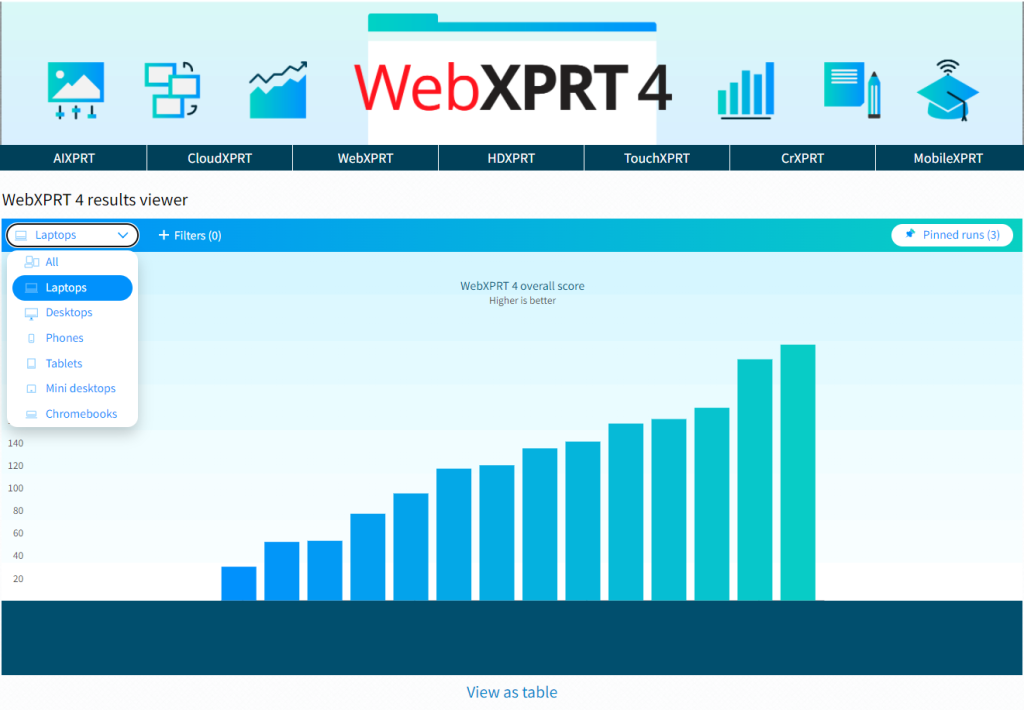
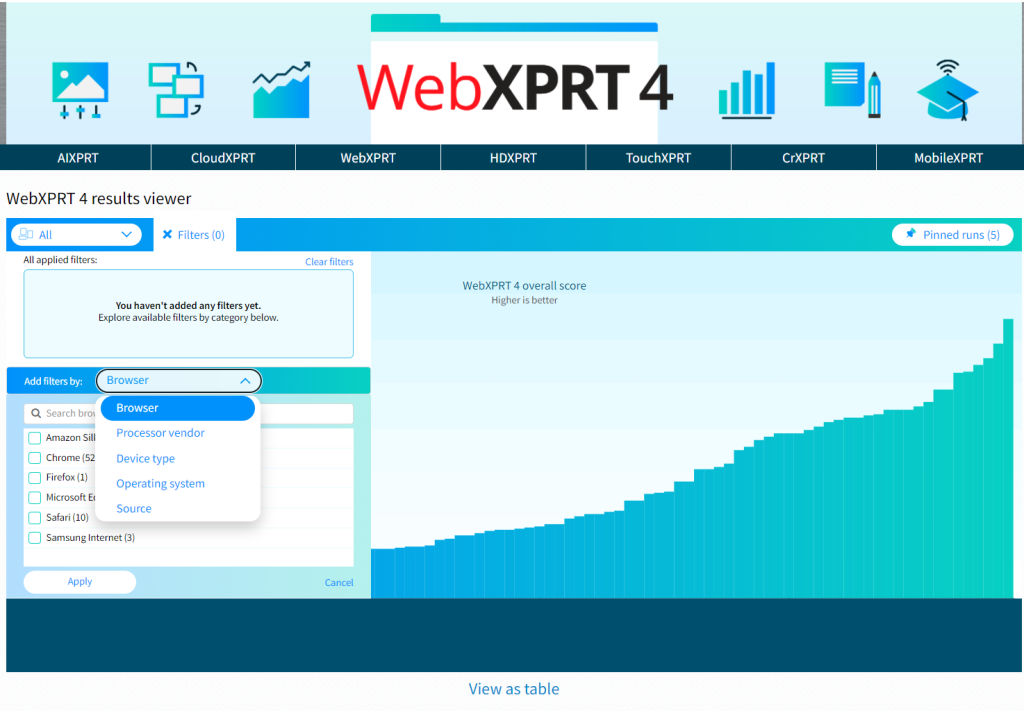
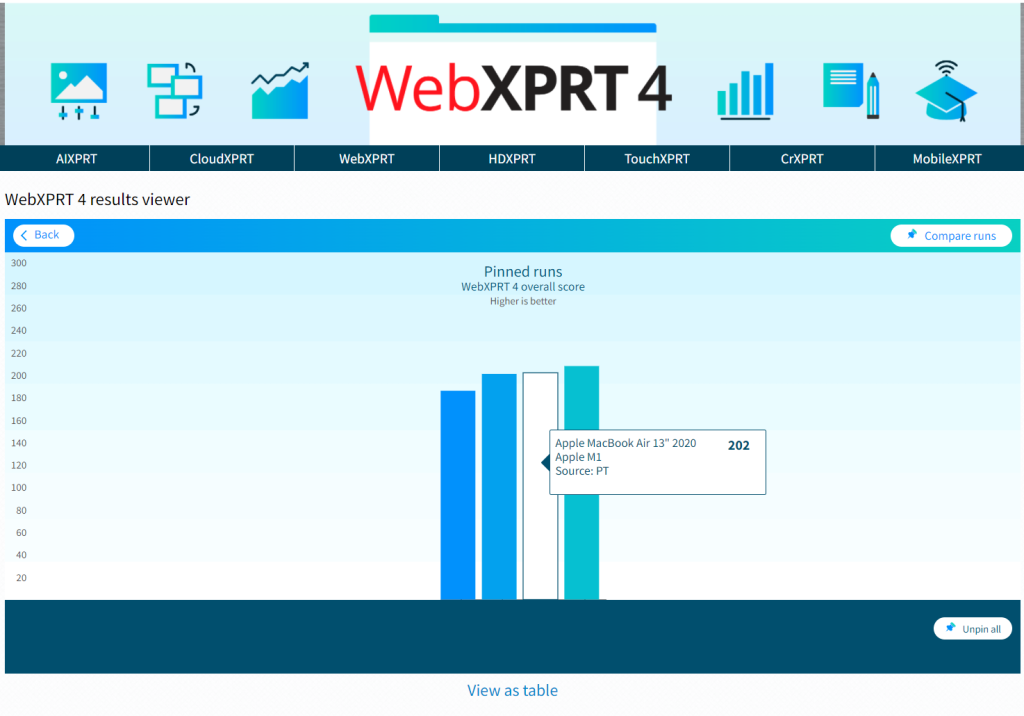
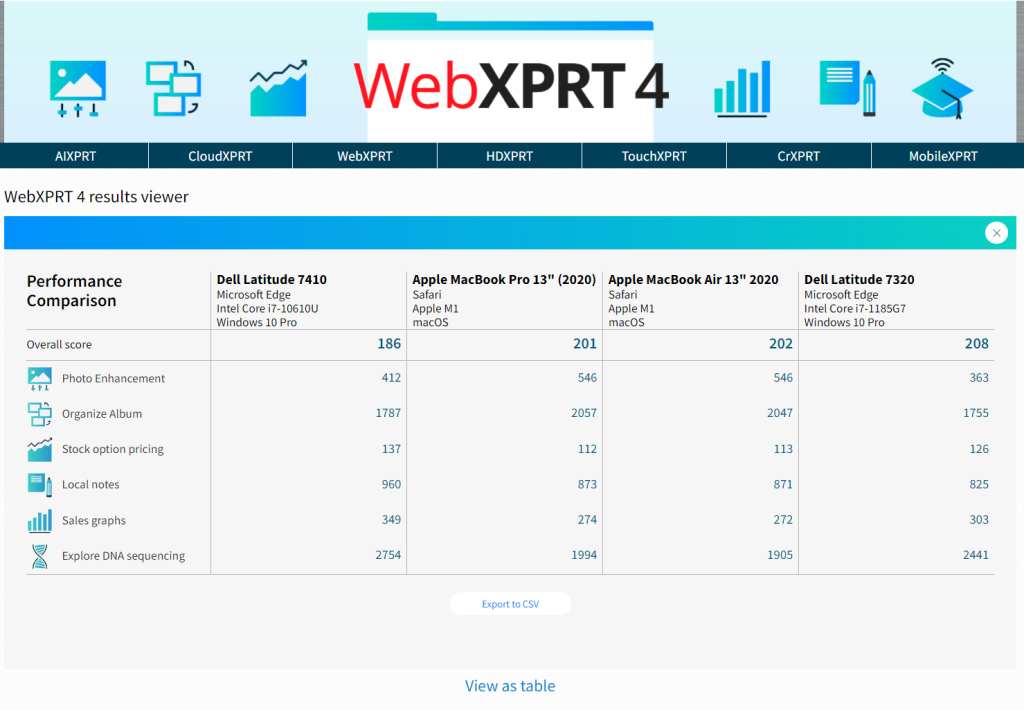
The third way to view information in our results database is with the WebXPRT 4 results viewer. The viewer provides an information-packed, interactive environment in which users can explore data from the curated set of WebXPRT 4 results we’ve published on our site. To learn more about the viewer’s capabilities and features, check out this blog post from March.
We hope you’ll take some time to browse the information in our results database. We welcome your feedback about what you’d like to see in the future and suggestions for improvement. Our database contains the XPRT scores that we’ve gathered, but we publish them as a resource for you. Let us know what you think!
Justin