BenchmarkXPRT Blog banner

Tag Archives: results

Shop confidently this holiday season with the XPRTs!

The holiday shopping season is upon us, and trying to find the right tech gift for your friends or loved ones (or yourself!) can be a daunting task. If you’re considering new phones, tablets, Chromebooks, laptops, or desktops as gifts this year—and are unsure where to get reliable device information—the XPRTs can help!

The XPRTs provide industry-trusted and time-tested measures of a device’s performance that can help you cut through the fog of competing marketing claims. For example, instead of guessing whether the performance of a new gaming laptop justifies its price, you can use its WebXPRT performance score to see how it stacks up against both older models and competitors while tackling everyday tasks.

A great place to start looking for device scores is our XPRT results browser, which lets you access our database of more than 3,700 test results—across all the XPRT benchmarks and hundreds of devices—from over 155 sources, including major tech review publications around the world, OEMs, our own Principled Technologies (PT) testing, and independent submissions. For tips on how to use the XPRT results browser, check out this blog post.

Another way to view information in our results database is by using the WebXPRT 4 results viewer. The viewer provides an information-packed, interactive tool that we created to help people explore data from the set of almost 800 WebXPRT 4 results we’ve curated and published to date on our site. You’ll find detailed instructions in this blog post for how to use the WebXPRT 4 results viewer tool.

If you’re considering a popular device, it’s likely that a recent tech press review includes an XPRT score for it. To find those scores, go to your favorite tech review site and search for “XPRT,” or enter the name of the device and the appropriate XPRT (e.g., “iPhone” and “WebXPRT”) in a search engine. Here are a few recent tech reviews that used the XPRTs to evaluate popular devices:

In addition to XPRT-related resources in the tech press, here at PT we frequently publish reports that evaluate the performance of hot new consumer devices, and many of those reports include WebXPRT scores. For example, check out the results from our extensive testing of a Dell Latitude 7450 AI PC or our in-depth evaluation of three new Lenovo ThinkPad and ThinkBook laptops.

The XPRTs can help you make better-informed and more confident tech purchases this holiday season. We hope you’ll find the data you need on our site or in an XPRT-related tech review. If you have any questions about the XPRTs, XPRT scores, or the results database, please feel free to ask!

Justin

Gain a deeper understanding of WebXPRT 4 with our results calculation white paper

More people around the world are using WebXPRT 4 now than ever before. It’s exciting to see that growth, which also means that many people are visiting our site and learning about the XPRTs for the first time. Because new visitors may not know how the XPRT family of benchmarks differs from other benchmarking efforts, we occasionally like to revisit the core values of our open development community here in the blog—and show how those values translate into more free resources for you.

One of our primary values is transparency in all our benchmark development and testing processes. We share information about our progress with XPRT users throughout the development process, and we invite people to contribute ideas and feedback along the way. We also publish both the source code of our benchmarks and detailed information about how they work, unlike benchmarks that use a “black box” model.

For WebXPRT 4 users who are interested in knowing more about the nuts and bolts of the benchmark, we offer several information-packed resources, including our focus for today, the WebXPRT 4 results calculation and confidence interval white paper. The white paper explains the WebXPRT 4 confidence interval, how it differs from typical benchmark variability, and the formulas the benchmark uses to calculate the individual workload scenario scores and overall score on the end-of-test results screen. The paper also provides an overview of the statistical methodology that WebXPRT uses to translate raw timings into scores.

In addition to the white paper’s discussion of the results calculation process, we’ve also provided a results calculation spreadsheet that shows the raw data from a sample test run and reproduces the calculations WebXPRT uses to generate both the workload scores and an overall score.

In potential future versions of WebXPRT, it’s likely that we’ll continue to use the same—or very similar—statistical methodologies and results calculation formulas that we’ve documented in the results calculation white paper and spreadsheet. That said, if you have suggestions for how we could improve those methods or formulas—either in part or in whole—please don’t hesitate to contact us. We’re interested in hearing your ideas!

The white paper is available on WebXPRT.com and on our XPRT white papers page. If you have any questions about the paper or spreadsheet, WebXPRT, or the XPRTs in general, please let us know.

Justin

Updating our WebXPRT 4 browser performance comparisons with new gear

Once or twice per year, we refresh an ongoing series of WebXPRT comparison tests to see if recent updates have reordered the performance rankings of popular web browsers. We published our most recent comparison in January, when we used WebXPRT 4 to compare the performance of five browsers on the same system.

This time, we’re publishing an updated set of comparison scores sooner than we normally would because we chose to move our testing to a newer reference laptop. The previous system—a Dell XPS 13 7930 with an Intel Core i3-10110U processor and 4 GB of RAM—is now several years old. We wanted to transition to a system that is more in line with current mid-range laptops. By choosing to test on a capable mid-tier laptop, our comparison scores are more likely to fall within the range of scores we would see from an typical user today.

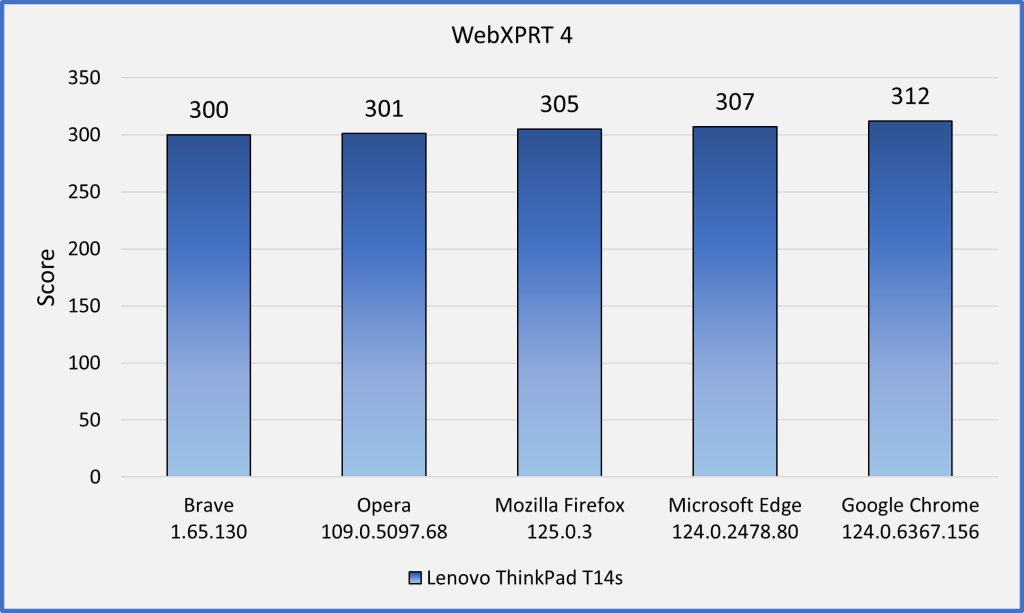
Our new reference system is a Lenovo ThinkPad T14s Gen 3 with an Intel Core i7-1270P processor and 16 GB of RAM. It’s running Windows 11 Home, updated to version 23H2 (22631.3527). Before testing, we installed all current Windows updates and tested on a clean system image. After the update process was complete, we turned off updates to prevent any further updates from interfering with test runs. We ran WebXPRT 4 three times each on five browsers: Brave, Google Chrome, Microsoft Edge, Mozilla Firefox, and Opera. In Figure 1 below, each browser’s score is the median of the three test runs.

In our last round of tests—on the Dell XPS 13—the four Chromium-based browsers (Brave, Chrome, Edge, and Opera) produced close scores, with Edge taking a small lead among the four. Each of the Chromium browsers significantly outperformed Firefox, with the slowest of the Chromium browsers (Brave) outperforming Firefox by 13.5 percent.

In this round of tests—on the Lenovo ThinkPad T14s—the scores were very tight, with a difference of only 4 percent between the last-place browser (Brave) and the winner (Chrome). Interestingly, Firefox no longer trailed the four Chromium browsers—it was squarely in the middle of the pack.

Figure 1: The median scores from running WebXPRT 4 three times with each browser on the Lenovo ThinkPad T14s.

Unlike previous rounds that showed a higher degree of performance differentiation between the browsers, scores from this round of tests are close enough that most users wouldn’t notice a difference. Even if the difference between the highest and lowest scores was substantial, the quality of your browsing experience will often depend on factors such as the types of things you do on the web (e.g., gaming, media consumption, or multi-tab browsing), the impact of extensions on performance, and how frequently the browsers issue updates and integrate new technologies, among other things. It’s important to keep such variables in mind when thinking about how browser performance comparison results may translate to your everyday web experience.

Have you tried using WebXPRT 4 to test the speed of different browsers on the same system? If so, we’d love for you to tell us about it! Also, please tell us what other WebXPRT data you’d like to see!

Justin

Want to see your WebXPRT 4 results on WebXPRT.com? Here’s how to submit them for review

In a recent post, we discussed some key features that the WebXPRT 4 results viewer tool has to offer. In today’s post, we’ll cover the straightforward process of submitting your WebXPRT 4 test results for possible publication in the viewer.

Unlike sites that publish all submissions, we publish only results that meet our evaluation criteria. Those results can come from OEM labs, third-party labs, reliable tech media sources, or independent user submissions. What’s important to us is that the scores must be consistent with general expectations, and for sources outside of our labs and data centers, they must include enough detailed system information that we can determine whether the score makes sense. That being said, if your scores are a little bit different from what you see in our database, please don’t hesitate to send them to us for consideration. It costs you nothing.

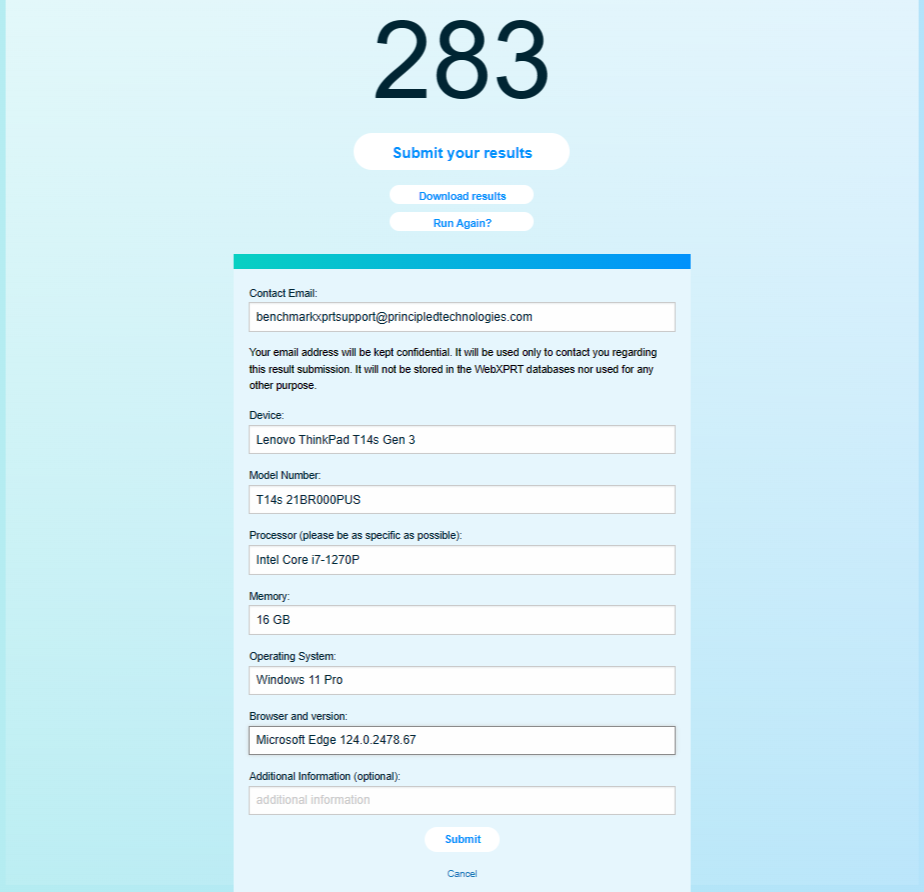
The actual result submission process is quick and easy. At the end of the WebXPRT test run, click the Submit your results button below the overall score, complete the short submission form, and click Submit again. Please be as specific as possible when filling in the system information fields. Detailed device information helps us assess whether individual scores represent valid test runs.

Figure 1 below shows how the form would look if I submitted a score at the end of a recent WebXPRT 4 run on one of the test systems here in our lab.

Figure 1: A screenshot of the WebXPRT 4 end-of-test results submission screen.

After you submit your score, we’ll contact you to confirm how we should display the source of the result in our database. You can choose one of the following:

  • Your first and last name
  • “Independent tester” (for users who wish to remain anonymous)
  • Your company’s name, if you have permission to submit the result in their name. If you want to use a company name, please provide a valid company email address that corresponds with the company name.

As always, we will not publish any additional information about you or your company without your permission.

We look forward to seeing your scores! If you have questions about WebXPRT 4 testing or results submission, please let us know!

Justin

The WebXPRT 4 results viewer: A powerful tool for browsing hundreds of test results

In our recent blog post about the XPRT results database, we promised to discuss the WebXPRT 4 results viewer in more detail. We developed the results viewer to serve as a feature-rich interactive tool that visitors to WebXPRT.com can use to browse the test results that we’ve published on our site, dig into the details of each result, and compare scores from multiple devices. The viewer currently has almost 700 test results, and we add new PT-curated entries each week.

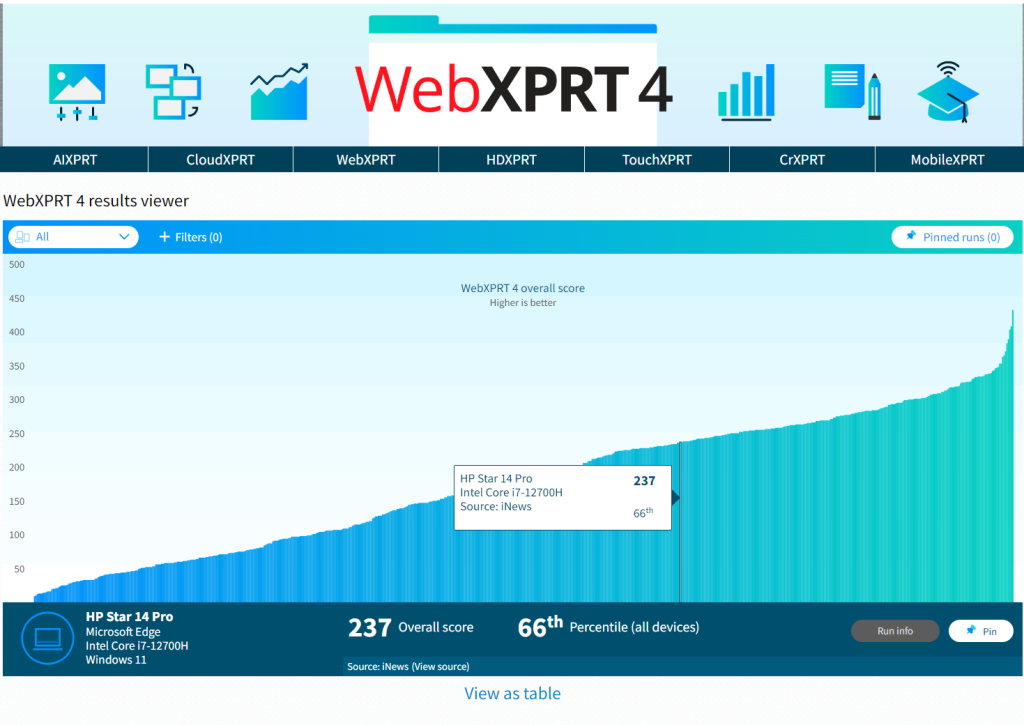
Figure 1 shows the tool’s default display. Each vertical bar in the graph represents the overall score of a single test result, with bars arranged left-to-right, from lowest to highest. To view a single result in detail, hover over a bar to highlight it, and a small popup window will display the basic details of the result. You can then click to select the highlighted bar. The bar will turn dark blue, and the dark blue banner at the bottom of the viewer will display additional details about that result.

Figure 1: The WebXPRT 4 results viewer tool’s default display

In the example in Figure 1, the banner shows the overall score (237), the score’s percentile rank (66th) among the scores in the current display, the name of the test device, and basic hardware configuration information. If the source of the result is PT, you can click the Run info button in the bottom right-hand corner of the display to see the run’s individual workload scores. If the source is an external publisher, users can click the Source link to navigate to the original site.

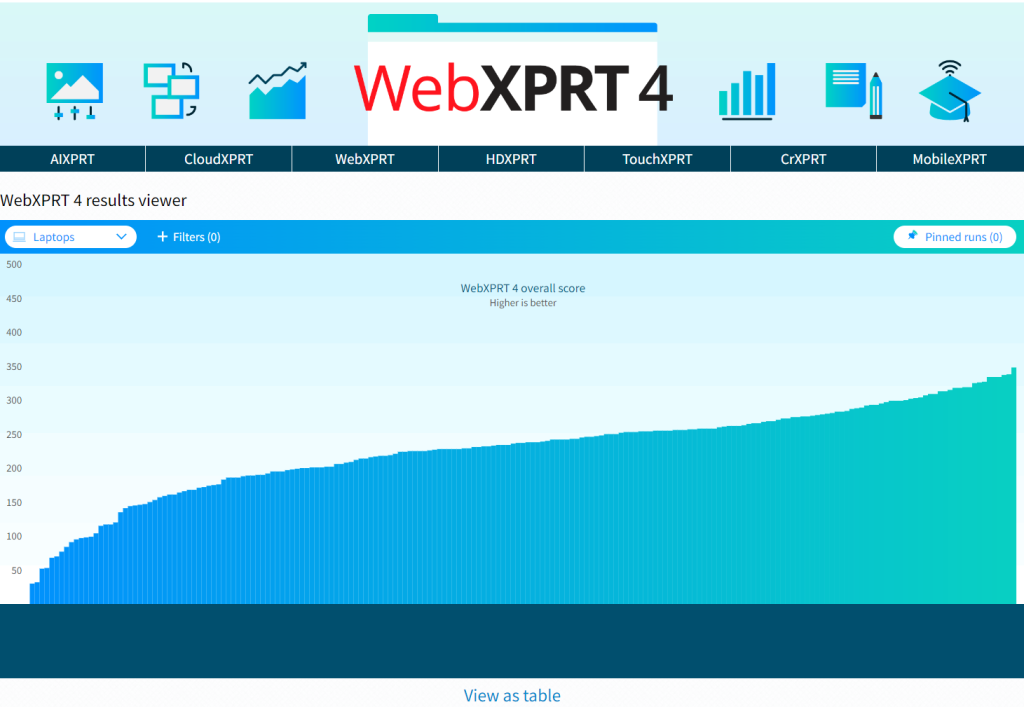
The viewer includes a drop-down menu that lets users quickly filter results by major device type categories, plus a tab with additional filtering options, such as browser type, processor vendor, and result source. Figure 2 shows the viewer after I used the device type drop-down filter to select only laptops.

Figure 2: Screenshot from the WebXPRT 4 results viewer showing results filtered by the device type drop-down menu.

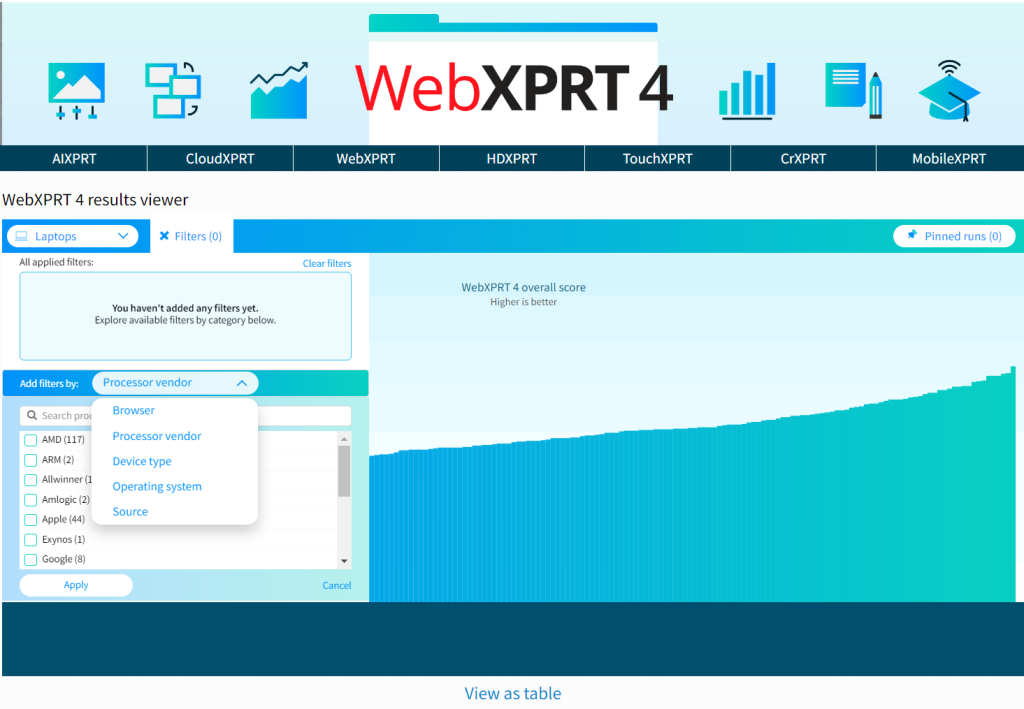
Figure 3 shows the viewer as I use the filter tab to explore additional filter options, such as processor vendor.

Figure 3: Screenshot from the WebXPRT 4 results viewer showing the filter options available with the filter tab.

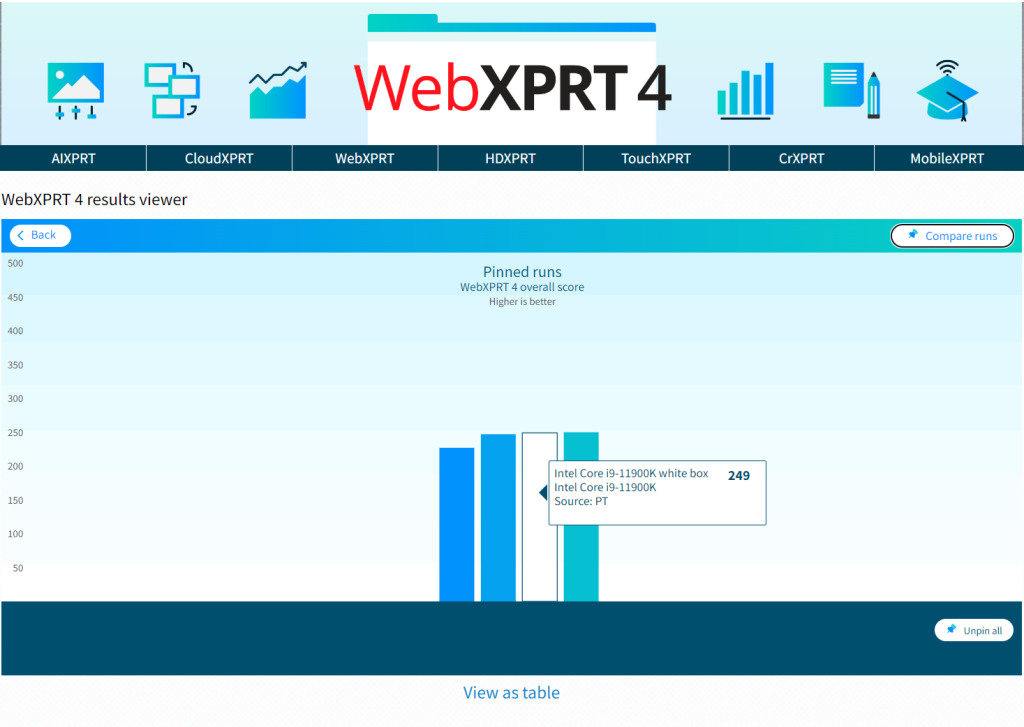
The viewer will also let you pin multiple specific runs, which is helpful for making side-by-side comparisons. Figure 4 shows the viewer after I pinned four runs and viewed them on the Pinned runs screen.

Figure 4: Screenshot from the WebXPRT 4 results viewer showing four pinned runs on the Pinned runs screen.

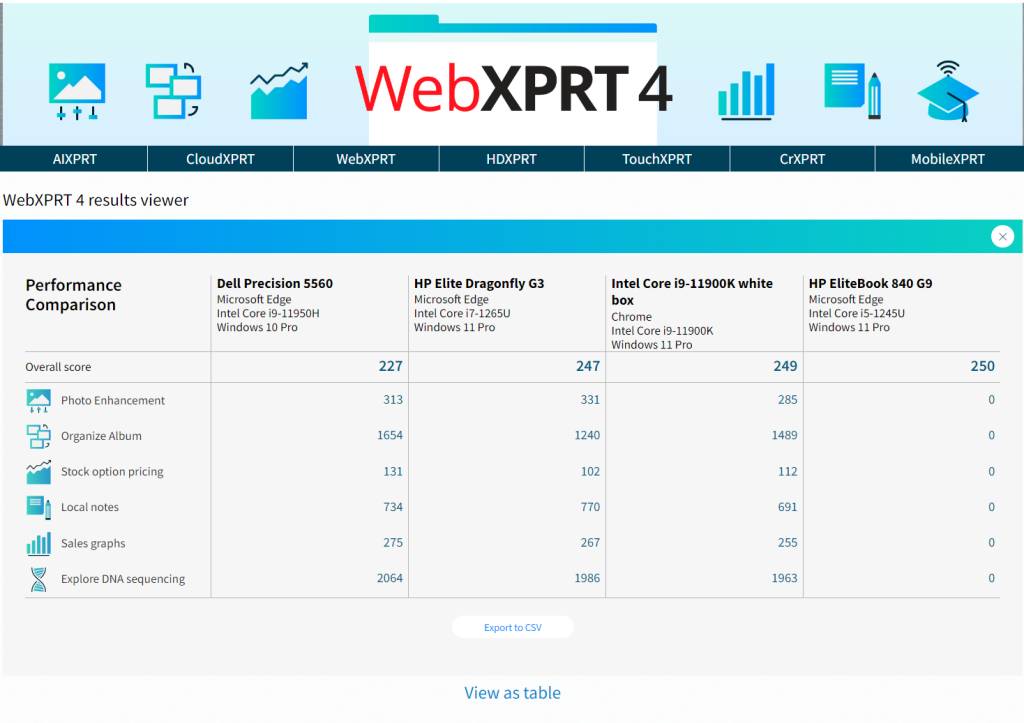
Figure 5 shows the viewer after I clicked the Compare runs button. The overall and individual workload scores of the pinned runs appear in a table.

Figure 5: Screenshot from the WebXPRT 4 results viewer showing four pinned runs on the Compare runs screen.

We hope that you’ll enjoy using the results viewer to browse our WebXPRT 4 results database and that it will become one of your go-to resources for device comparison data.  

Are there additional features you’d like to see in the viewer, or other ways we can improve it? Please let us know, and send us your latest test results!

Justin

Want to know how your device performs? Explore the XPRT results database

If you only recently started using the XPRT benchmarks, you may not know about one of the free resources we offer—the XPRT results database. Our results database currently holds more than 3,650 test results from over 150 sources, including global tech press outlets, OEM labs, and independent testers. It serves as a treasure trove of current and historical performance data across all the XPRT benchmarks and hundreds of devices. You can use these results and the results of the same XPRTs on your device to get a sense of how well your device performs.

We update the results database several times a week, adding selected results from our own internal lab testing, reliable media sources, and end-of-test user submissions. (After you run one of the XPRTs, you can choose to submit the results, but don’t worry—this is opt-in. Your results do not automatically appear in the database.) Before adding a result, we also look at any available system information and evaluate whether the score makes sense and is consistent with general expectations.

There are three primary ways that you can explore the XPRT results database.

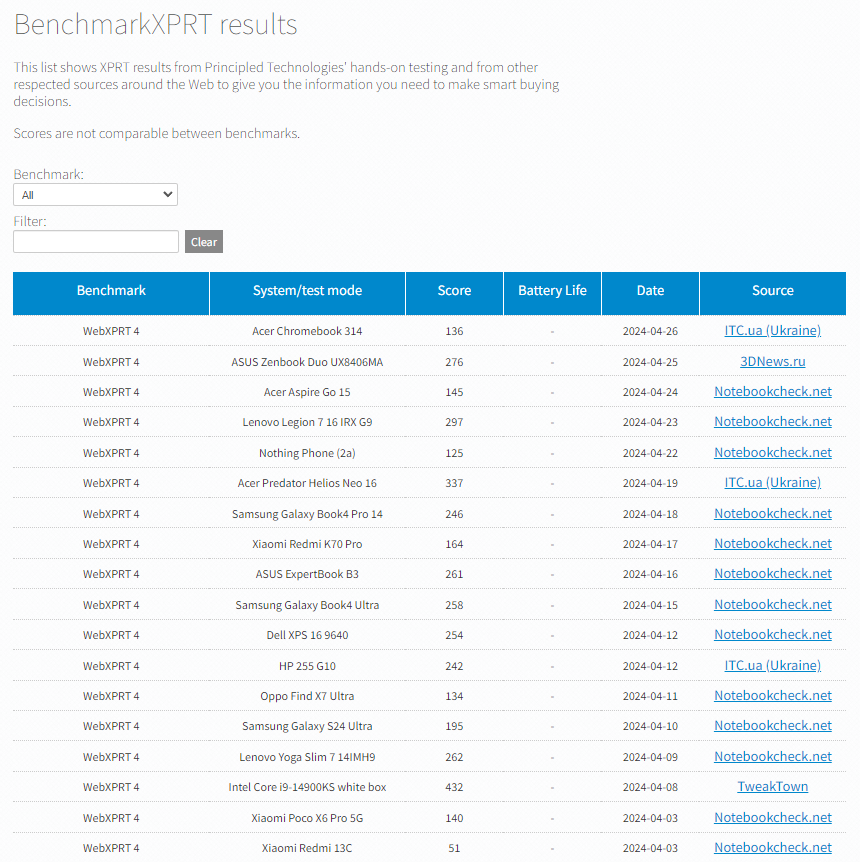
The first is by visiting the main BenchmarkXPRT results browser, which displays results entries for all of the XPRT benchmarks in chronological order (see the screenshot below). You can filter the results by selecting a benchmark from the drop-down menu. You can also type values, such as a vendor name (e.g., Dell) or the name of a tech publication (e.g., PCWorld) into the free-form filter field. For results we’ve produced in our lab, clicking “PT” in the Source column takes you to a page with additional configuration information for the test system. For sources outside our lab, clicking the source name takes you to the original article or review that contains the result.

The second way to access our published results is by visiting the results page for an individual XPRT benchmark. Start by going to the page of the benchmark that interests you (e.g., CrXPRT.com) , and looking for the blue View Results button. Clicking the button takes you to a page that displays results for only that benchmark. You can use the free-form filter on the page to filter those results, and you can use the Benchmarks drop-down menu to jump to the other individual XPRT results pages.

The third way to view our results database is with the WebXPRT 4 results viewer. The viewer provides an information-packed, interactive tool with which you can explore data from the curated set of WebXPRT 4 results we’ve published on our site. We’ll discuss the features of the WebXPRT 4 results viewer in more detail in a future post.

You can use any of these approaches to compare the results of an XPRT on your device with our many published results. We hope you’ll take some time to explore the information in our results database and that it proves to be helpful to you. If you have ideas for new features or suggestions for improvement, we’d love to hear from you!

Justin

Check out the other XPRTs:

Forgot your password?