BenchmarkXPRT Blog banner

Tag Archives: Performance

CrXPRT is more valuable than ever

Digital Trends recently published an article discussing various rumors about the future of the Google Pixelbook line. Pixelbooks were some of the first Chromebooks with high-end hardware specs, and they were priced accordingly. Whether or not the rumors discussed in the article turn out to be true, the author points out that the Pixelbook prompted several other vendors, such as HP and Lenovo, to take a chance on high-end Chromebooks. It seems like high-end Chromebooks are here to stay, but given the unique constraints of the Chrome OS environment, buyers are often unsure if it’s worth it to shell out the extra money for a premium model.

We developed CrXPRT to help buyers answer these questions. CrXPRT is a benchmark tool that measures the battery life of your Chromebook as well as how fast it handles everyday tasks like playing video games, watching movies, editing pictures, and doing homework. The performance test gives you individual workload scores and an overall score based on the speed of the device. The battery life test produces an estimated battery life time, a separate performance score, and a frames-per-second (FPS) rate for a built-in HTML5 gaming component.

You don’t have to be a tech journalist or even a techie to use CrXPRT. To learn more, check out the links below.

Testing the performance or battery life of your Chromebook

Simply download CrXPRT from the Chrome Web Store. Installation is quick and easy, and the CrXPRT 2015 user manual provides step-by-step instructions. A typical performance test takes about 15 minutes, and a battery life test will take 3.5 hours once the system is charged and configured for testing. If you’d like to see how your score compares to other Chromebooks, visit the CrXPRT results page.

Want to know more?

Read the Exploring CrXPRT 2015 white paper, where we discuss the concepts behind CrXPRT, its development process, and the app’s structure. We also describe the component tests and explain the statistical processes used to calculate expected battery life.

BenchmarkXPRT Development Community members also have access to the CrXPRT source code, so if you’re interested, join today! There’s no obligation and membership is free for members of any company or organization with an interest in benchmarks.

Give CrXPRT a try and let us know what you think!

Justin

A new BatteryXPRT 2014 for Android build is available

In last week’s blog, we discussed why we now consider full BatteryXPRT rundown tests to be the most accurate and why we’re releasing a new build (v110) that increases the default BatteryXPRT test from 5.25 hours (seven iterations) to 45 hours (60 iterations). We also built v110 using Android Studio SDK 27, in order to bring BatteryXPRT up to date with current Android standards. Today, we’ve posted the new build on BatteryXPRT.com and in the Google Play Store, and we’ve also published an updated user manual. Please contact us if you have any questions about BatteryXPRT testing.

Justin

The new WebXPRT 3 Processor Comparison Chart

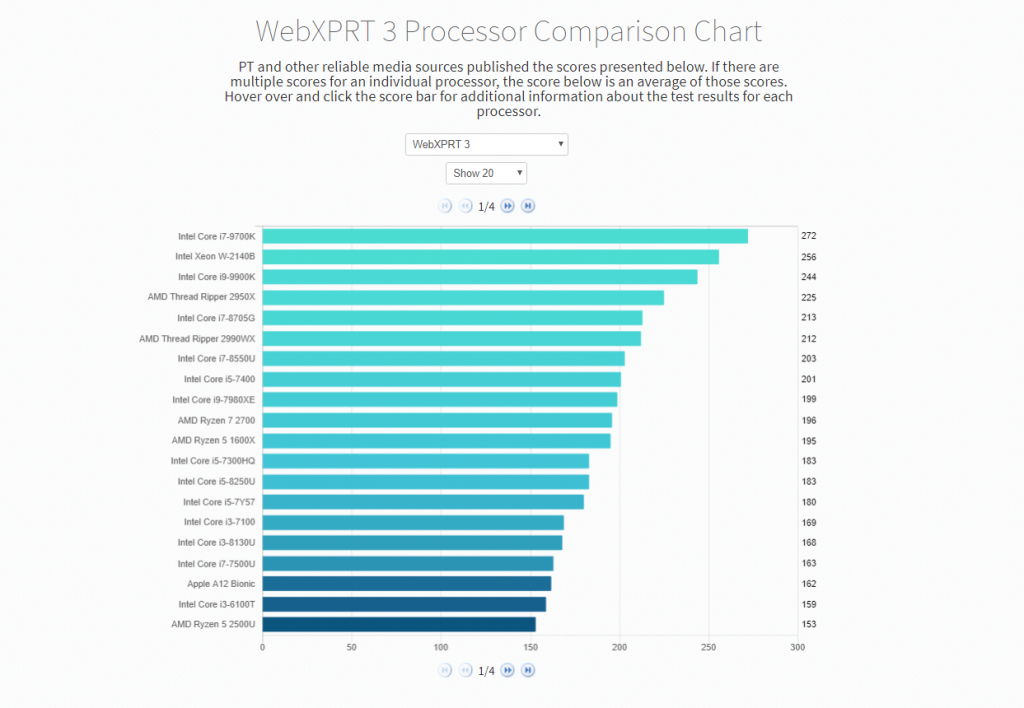
Last fall, we published the WebXPRT 2015 Processor Comparison Chart, a tool that makes it easier to access hundreds of PT-curated, real-world performance scores from a wide range of devices including everything from TVs to phones to tablets to PCs. Today, we’re happy to announce that we’ve added a WebXPRT 3 Processor Comparison Chart.

The WebXPRT 3 chart follows the same format as the WebXPRT 2015 chart, letting you click the average score of each processor to view all the WebXPRT 3 results we currently have for that processor. You can change the number of results the chart displays on each page, and as the screenshot below shows, a new drop-down menu lets you toggle back and forth between the WebXPRT 3 and WebXPRT 2015 charts. W plan to add additional capabilities on a regular basis, so if you have ideas for features and types of data you’d like to see, let us know!

If you’d like to submit results for us to consider for publication in the chart, follow the detailed instructions here. The submission process is quick and easy. We look forward to seeing your results!

WebXPRT 3 Proc Chart

Justin

Notes from the lab: choosing a calibration system for MobileXPRT 3

Last week, we shared some details about what to expect in MobileXPRT 3. This week, we want to provide some insight into one part of the MobileXPRT development process, choosing a calibration system.

First, some background. For each of the benchmarks in the XPRT family, we select a calibration system using criteria we’ll explain below. This system serves as a reference point, and we use it to calculate scores that will help users understand a single benchmark result. The calibration system for MobileXPRT 2015 is the Motorola DROID RAZR M. We structured our calculation process so that the mean performance score from repeated MobileXPRT 2015 runs on that device is 100. A device that completes the same workloads 20 percent faster than the DROID RAZR M would have a performance score of 120, and one that performs the test 20 percent more slowly would have a score of 80. (You can find a more in-depth explanation of MobileXPRT score calculations in the Exploring MobileXPRT 2015 white paper.)

When selecting a calibration device, we are looking for a relevant reference point in today’s market. The device should be neither too slow to handle modern workloads nor so fast that it outscores most devices on the market. It should represent a level of performance that is close to what the majority of consumers experience, and one that will continue to be relevant for some time. This approach helps to build context for the meaning of the benchmark’s overall score. Without that context, testers can’t tell whether a score is fast or slow just by looking at the raw number. When compared to a well-known standard such as the calibration device, however, the score has more informative value.

To determine a suitable calibration device for MobileXPRT 3, we started by researching the most popular Android phones by market share around the world. It soon became clear that in many major markets, the Samsung Galaxy S8 ranked first or second, or at least appeared in the top five. As last year’s first Samsung flagship, the S8 is no longer on the cutting edge, but it has specs that many current mid-range phones are deploying, and the hardware should remain relevant for a couple of years.

For all of these reasons, we made the Samsung Galaxy S8 the calibration device for MobileXPRT 3. The model in our lab has a Qualcomm Snapdragon 835 SoC, 4 GB of RAM, and runs Android 7.0 (Nougat). We think it has the balance we’re looking for.

If you have any questions or concerns about MobileXPRT 3, calibration devices, or score calculations, please let us know. We look forward to sharing more information about MobileXPRT 3 as we get closer to the community preview.

Justin

Check out the other XPRTs:

Forgot your password?