BenchmarkXPRT Blog banner

Tag Archives: Performance

Our results database, your resource

Testers who have started using the XPRT benchmarks recently may not know about one of the free resources we offer. The XPRT results database currently holds more than 2,400 test results from over 90 sources, including major tech review publications around the world, OEMs, and independent testers. It offers a wealth of current and historical performance data across all the XPRT benchmarks and hundreds of devices.

We update the results database several times a week, adding selected results from our own internal lab testing, end-of-test user submissions, and reliable tech media sources. (After you run one of the XPRTs, you can choose to submit the results, but they don’t automatically appear in the database.)

Before adding a result, we evaluate whether the score makes sense and is consistent with general expectations, which we can do only when we have sufficient system information details. For that reason, we encourage testers to disclose as much hardware and software information as possible when publishing or submitting a result.

We encourage visitors to our site to explore the XPRT results database. There are three primary ways to do so. The first is by visiting the main BenchmarkXPRT results browser, which displays results entries for all of the XPRT benchmarks in chronological order (see the screenshot below). Users can narrow the results by selecting a benchmark from the drop-down menu and can type values, such as vendor or the name of a tech publication, into the free-form filter field. For results we produced in our lab, clicking “PT” in the Source column takes you to a page with additional disclosure information for the test system. For sources outside our lab, clicking the source name takes you to the original article or review that contains the result.
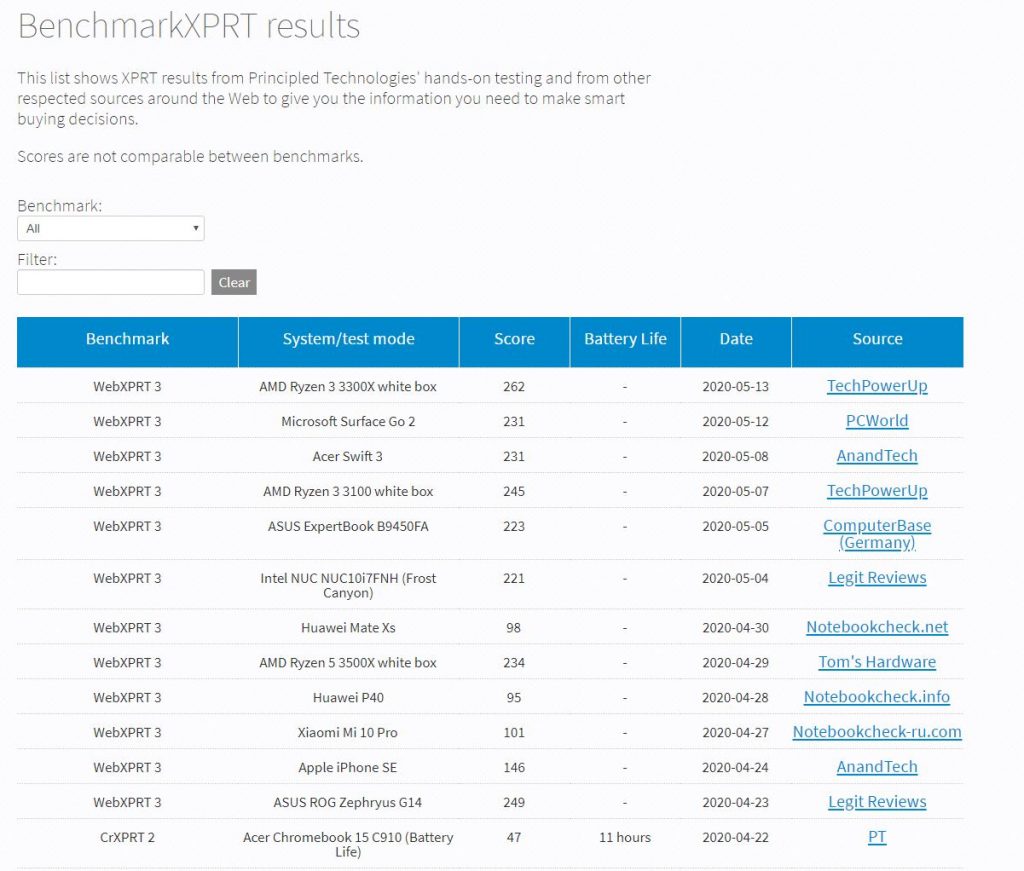
The second way to access our published results is by visiting the results page for each individual XPRT benchmark. Go the page of the benchmark you’re interested in, and look for the blue View Results button. Clicking it takes you to a page that displays results for only that benchmark. You can use the free-form filter on the page to filter those results, and can use the Benchmarks drop-down menu to jump to the other individual XPRT results pages.

The third way to view information in our results database is with the WebXPRT Processor Comparison Chart. When we publish a new WebXPRT result, the score automatically appears in the processor comparison chart as well. For each processor, the chart shows a bar representing the average score. Mousing over the bar displays a popup indicating the number of WebXPRT results we currently have for that processor and clicking the bar lets you view the results. You can change the number of results the chart displays on each page, and use the drop-down menu to toggle back and forth between the WebXPRT 3 and WebXPRT 2015 charts.

We hope you’ll take some time to browse the information in our results database. We welcome your feedback about what you’d like to see in the future and suggestions for improvement. Our database contains the XPRT scores that we’ve gathered, but we publish them as a resource for you. Let us know what you think!

Justin

The CrXPRT 2 Community Preview is available!

We’re excited to announce that the CrXPRT 2 Community Preview (CP) is now available! BenchmarkXPRT Development Community members can access the preview using a direct link posted on the CrXPRT tab in the XPRT Members’ Area (login required), where they will also find the CrXPRT 2 CP user manual.

You can find more information about the key differences between CrXPRT 2015 and CrXPRT 2 in last week’s blog entry. During the preview period, we allow testers to publish CP test scores, but CrXPRT 2 overall performance test scores and battery life measurements are not comparable to CrXPRT 2015 scores.

If you have any questions about CrXPRT 2 or joining the community, please let us know!

Justin

A preview of the new CrXPRT 2 UI

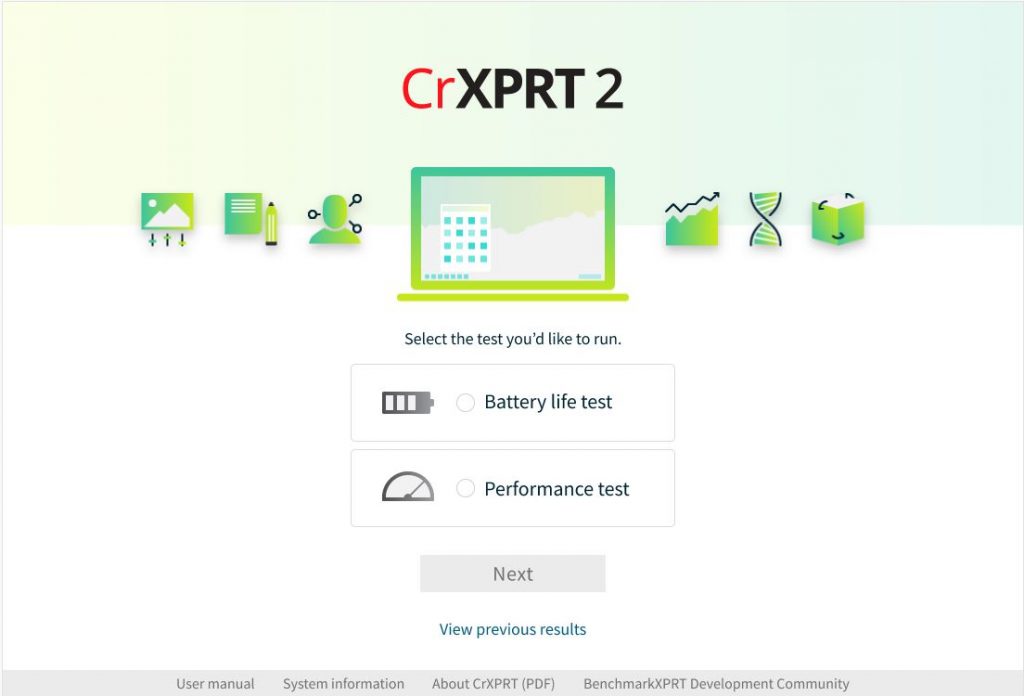
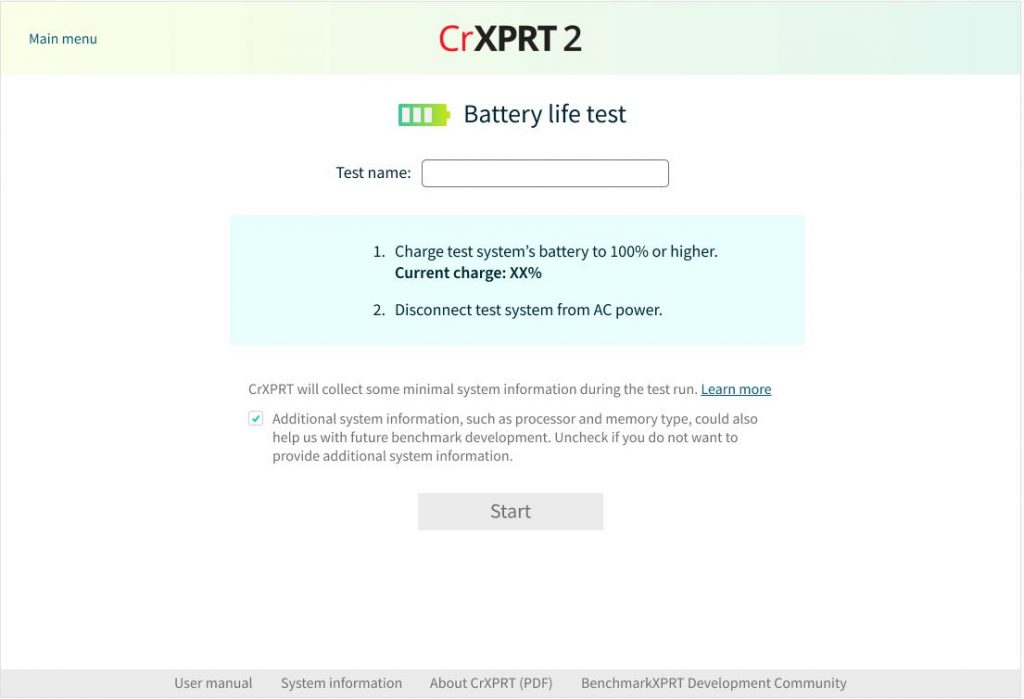
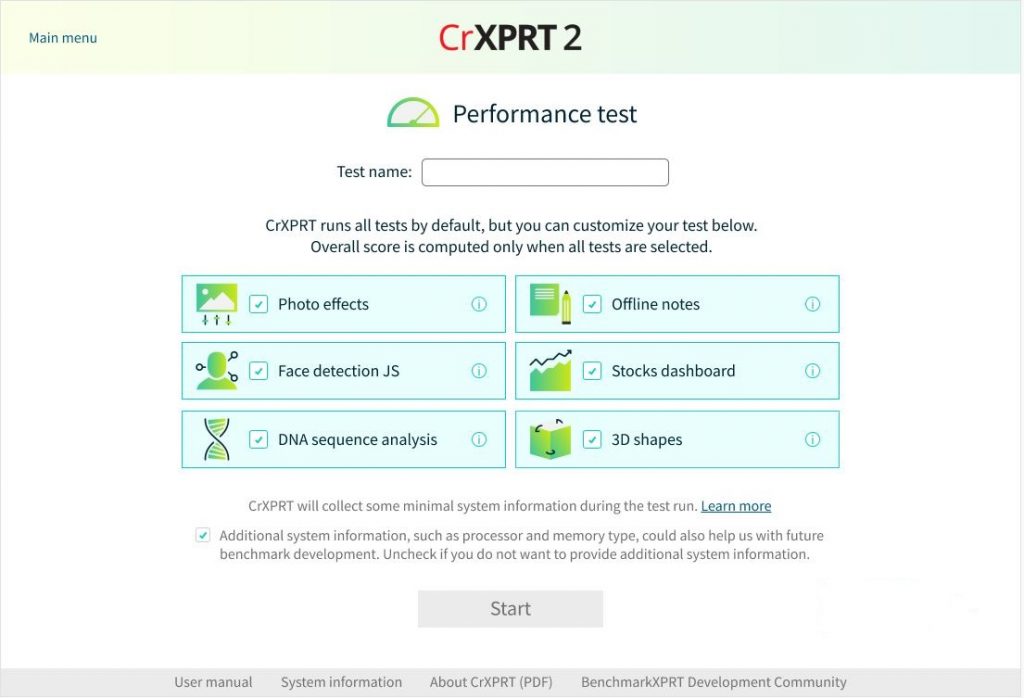
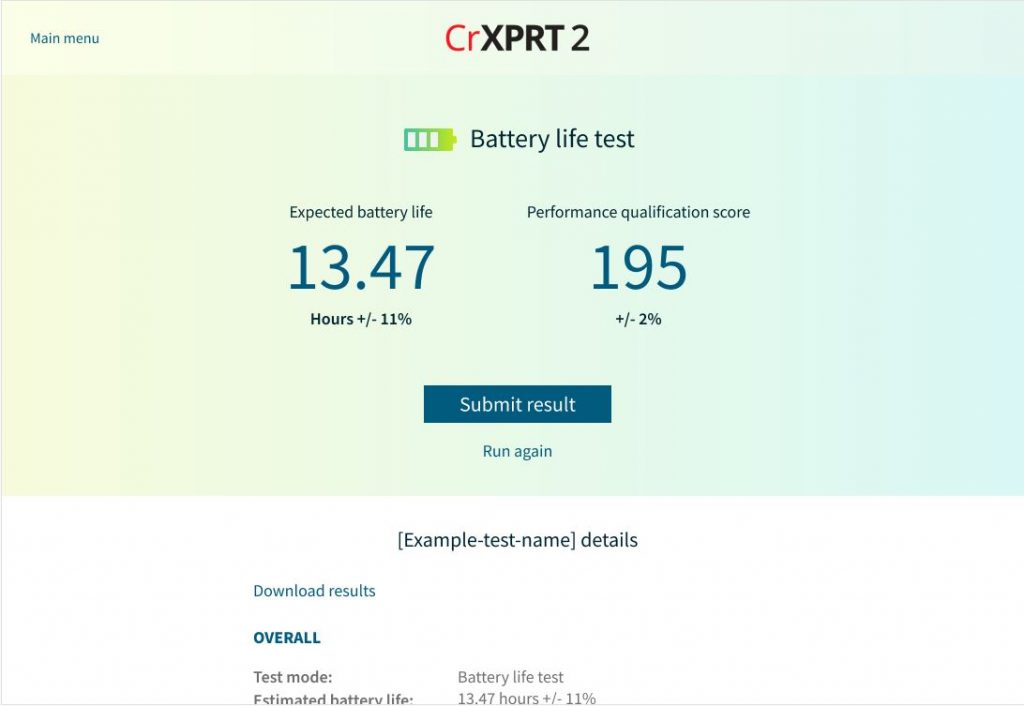
As we get closer to the CrXPRT 2 Community Preview (CP), we want to provide readers with a glimpse of the new CrXPRT 2 UI. In line with the functional and aesthetic themes we used for the latest versions of WebXPRT, MobileXPRT, and HDXPRT, we’re implementing a clean, bright look with a focus on intuitive navigation. The screenshots below show how we’ve used that approach to rework the home, battery life test, performance test, and battery life test results screens. (We’re still tweaking the UI, so the screens you see in the CP may differ slightly.)

On the home screen, we kept the performance test and battery life test buttons, but made it clearer that you can choose only one. We also added a link to the user manual to the bottom ribbon for quick access.

If you choose to run a battery life test and click Next, the screen below appears. The CrXPRT 2 battery life test requires a full rundown, so you’ll need charge your device to 100 percent before you can start the test. Once you’ve done that, enter a name for the test run, unplug the system, and click Start. (Note that you no longer need to enter values for screen brightness and audio levels.)

The CrXPRT 2 performance test includes updated versions of six of the seven workloads in CrXPRT 2015. (As we discussed in a previous blog post, newer versions of Chrome can’t run the Photo Collage workload without a workaround, so we removed it from CrXPRT 2.)  To run the performance test, enter a name for the test run, customize the workloads if you wish, and click Start.

For the results screens, we wanted to highlight the most important end-of-test information while still offering clear paths for options such as getting additional details on the test, submitting results, and running the test again. Below, we show the results screen from a battery life test. Note the “Main menu” link in the upper-left corner, which we added to all screens to give users a quick way to navigate back to the home screen.

CrXPRT 2 development and testing are still underway. We don’t yet have an exact release date for the CP, but once we do, we’ll announce it here in the blog.

What do you think about the new CrXPRT 2 UI? Let us know!

Justin

WebXPRT: What would you like to see?

At over 412,000 runs and counting, WebXPRT is our most popular benchmark. From the first release in 2013, it’s been popular with device manufacturers, developers, tech journalists, and consumers because it’s easy to run, it runs on almost anything with a web browser, and it evaluates device performance using the types of web-based tasks that people are likely to encounter on a daily basis.

With each new version of WebXPRT, we analyze browser development trends to make sure the test’s underlying web technologies and workload scenarios adequately reflect the ways people are using their browsers to work and play. BenchmarkXPRT Development Community members can play an important part in that process by sending us feedback on existing tests and suggestions for new workloads to include.

For example, when we released WebXPRT 3, we updated the photo workloads with new images and a deep learning task used for image classification. We also added an optical character recognition task in the Encrypt Notes and OCR scan workload, and combined part of the DNA Sequence Analysis scenario with a writing sample/spell check scenario to simulate online homework in an all-new Online Homework workload.

Consider for a moment what an ideal future version of WebXPRT would look like for you. Are there new web technologies or workload scenarios that you would like to see? Would you be interested in an associated battery life test? Should we include experimental tests? We’re interested in what you have to say, so please feel free to contact us with your thoughts or questions.

If you’re just now learning about WebXPRT, we offer several resources to help you better understand the benchmark and its range of uses. For a general overview of why WebXPRT matters, watch our video titled What is WebXPRT and why should I care? To read more about the details of the benchmark’s development and structure, check out the Exploring WebXPRT 3 white paper. To see WebXPRT 2015 and WebXPRT 3 scores from a wide range of processors, visit the WebXPRT 3 Processor Comparison Chart.

We look forward to hearing from you!

Justin

A new playing field for WebXPRT

WebXPRT is one of the go-to benchmarks for evaluating browser performance, so we’re always interested in browser development news. Recently, Microsoft created a development channel where anyone can download early versions of an all-new Microsoft Edge browser. Unlike previous versions of Edge, Microsoft constructed the new browser using the Chromium open-source project, the same foundation underlying the Google Chrome browser and Chrome OS.

One interesting aspect of the new Edge development strategy is the changes that Microsoft is making to more than 50 services that Chromium has included. If you use Chrome daily, you’ve likely become accustomed to certain built-in services such as ad block, spellcheck, translate, maps integration, and form fill, among many others. While each of these is useful, a large number of background services running simultaneously can slow browsing and sap battery life. In the new Edge, Microsoft is either reworking each service or removing it altogether, with the hope of winning users by providing a cleaner, faster, and more power-efficient experience. You can read more about Microsoft’s goals for the new project on the Microsoft Edge Insider site.

As we’ve discussed before, many factors contribute to the speed of a browsing experience and its WebXPRT score. It’s too early to know how the new Microsoft Edge will stack up against other browsers, but when the full version comes out of development, you can be sure that we’ll be publishing some comparison scores. I’ve installed the Dev Channel version of Edge on my personal machine and run WebXPRT 3. While I can’t publish the scores from this early version, I can tell you that the results were interesting. Have you run WebXPRT 3 on the new Microsoft Edge? How do you think it compares to competitors? We’d love to hear your thoughts.

Justin

BatteryXPRT provides the objective battery life data that shoppers need

Over the last few weeks, we’ve discussed the capabilities and benefits of TouchXPRT and CrXPRT. This week, we’d like to reintroduce readers to BatteryXPRT, our app that evaluates the battery life and performance of Android devices.

Battery life for phones and tablets has improved dramatically over the last several years, to the point where many devices can support continuous use for well over a full work day on a single charge. This improvement is the result of advances in battery hardware technology, increased processor efficiency, and smarter utilization of software services by the operating system. Battery life has increased to some extent for most device categories and price points. However, enough of a range remains between devices at each level that access to objective battery life data is valuable for device shoppers.

Without BatteryXPRT, shoppers must rely on manufacturer estimates or full rundown tests that don’t resemble the types of things we do with our phones and tablets every day. A rundown test that surfs the web continuously for over 15 hours reveals which devices last the longest performing that specific task. It doesn’t tell you which devices last the longest over a full day performing a variety of common activities such as web browsing, watching videos, browsing and editing photos, playing music, and periodically sleeping. During BatteryXPRT’s battery life test, the app executes those same types of tasks and produces a performance score based on the speed with which a device completes each task.

BatteryXPRT provides an intuitive user interface in English and Simplified Chinese, and easy-to-understand results for both battery life and performance. Because your data connection can have a significant effect on battery life, BatteryXPRT runs in airplane mode, connected to the Internet via Wi-Fi, or connected to the Internet through a cellular data connection.

BatteryXPRT is easy to install and run, and is a great resource for anyone who wants to evaluate how well an Android device will meet their needs. If you’d like to see test results from a variety of Android devices, go to BatteryXPRT.com and click View Results, where you’ll find scores from many different Android devices.

If you’d like to run BatteryXPRT

Simply download BatteryXPRT from the Google Play store or BatteryXPRT.com. The BatteryXPRT installation instructions and user manual provide step-by-step instructions for configuring your device and kicking off a test. We designed BatteryXPRT to be compatible with a wide variety of Android devices, but because there are so many devices on the market, it is inevitable that users occasionally run into problems. In the Tips, tricks, and known issues document, we provide troubleshooting suggestions for issues we encountered during development testing.

If you’d like to learn more

The Exploring BatteryXPRT 2014 for Android white paper covers almost every aspect of the benchmark. In it, we explain the guiding concepts behind BatteryXPRT’s development, as well as the benchmark’s structure. We describe the component tests, the differences between the app’s Airplane and Network/Wi-Fi modes, and the statistical processes used to calculate expected battery life.

Justin

Check out the other XPRTs:

Forgot your password?