BenchmarkXPRT Blog banner

Tag Archives: browser benchmark

Thinking about experimental WebXPRT workloads in 2022

As the WebXPRT 4 development process has progressed, we’ve started to discuss the possibility of offering experimental WebXPRT 4 workloads in 2022. These would be optional workloads that test cutting-edge browser technologies or new use cases. The individual scores for the experimental workloads would stand alone, and would not factor in the WebXPRT 4 overall score.

WebXPRT testers would be able to run the experimental workloads one of two ways: by manually selecting them on the benchmark’s home screen, or by adjusting a value in the WebXPRT 4 automation scripts.

Testers would benefit from experimental workloads by being able to compare how well certain browsers or systems handle new tasks (e.g., new web apps or AI capabilities). We would benefit from fielding workloads for large-scale testing and user feedback before we commit to including them as core WebXPRT workloads.

Do you have any general thoughts about experimental workloads for browser performance testing, or any specific workloads that you’d like us to consider? Please let us know.

Justin

An early preview of the new WebXPRT 4 results viewer!

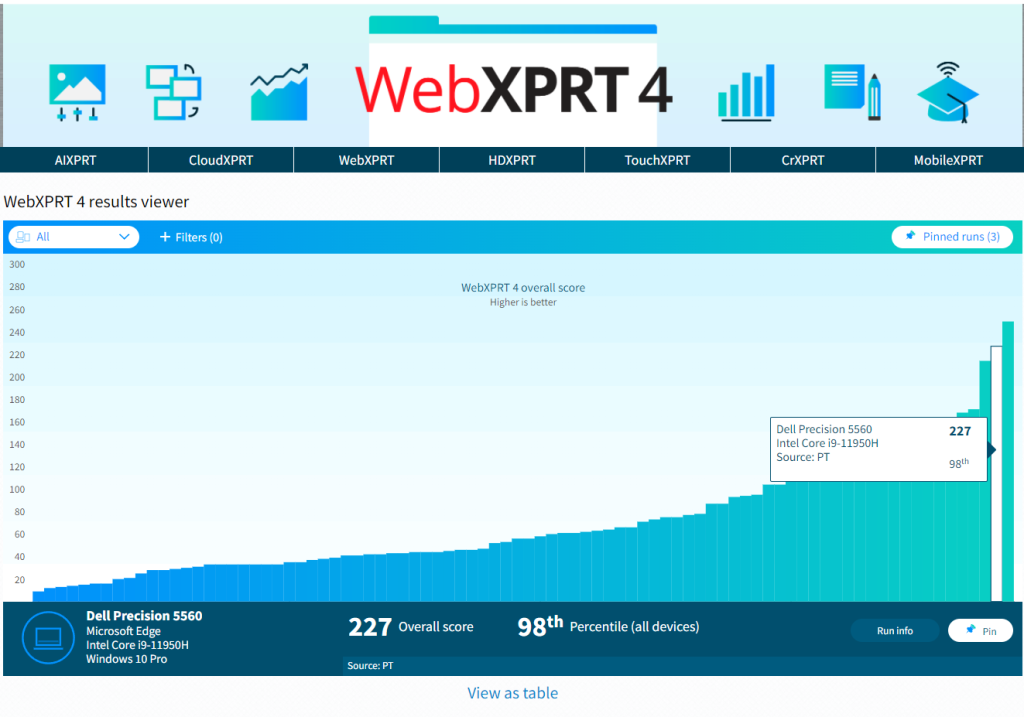
Last week, we shared some new details about the changes we’re likely to make in WebXPRT 4, and a rough target date for publishing a preview build. This week, we’re excited to share an early preview of the new results viewer tool that we plan to release in conjunction with WebXPRT 4. We hope the tool will help testers and analysts access the wealth of WebXPRT test results in our database in an efficient, productive, and enjoyable way. We’re still ironing out many of the details, so some aspects of what we’re showing today might change, but we’d like to give you an idea of what to expect.

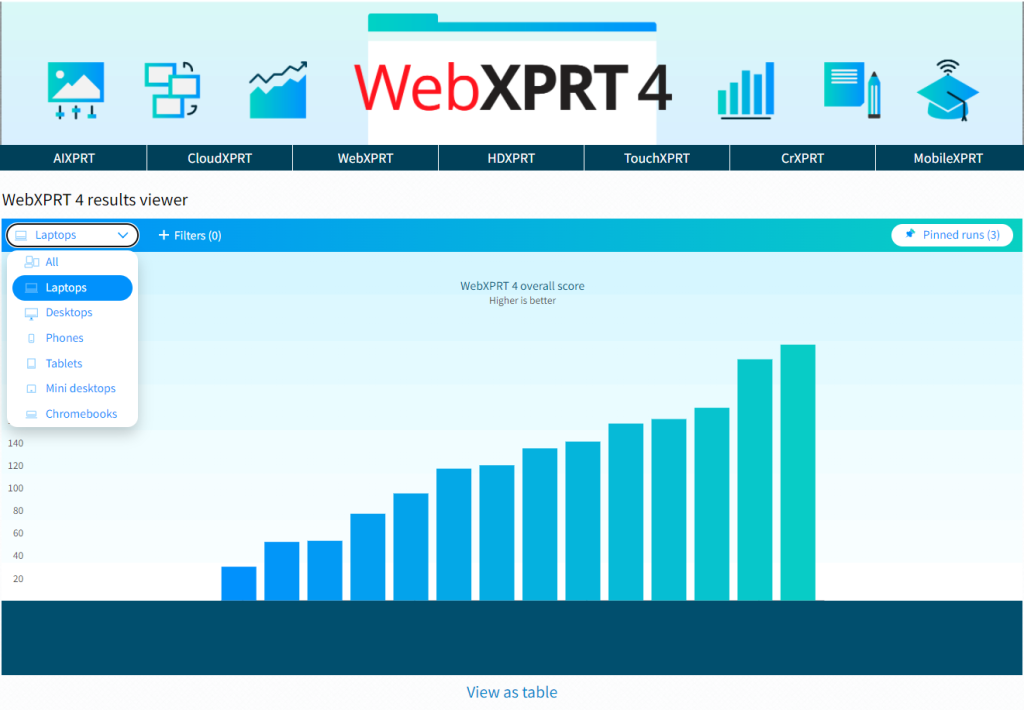
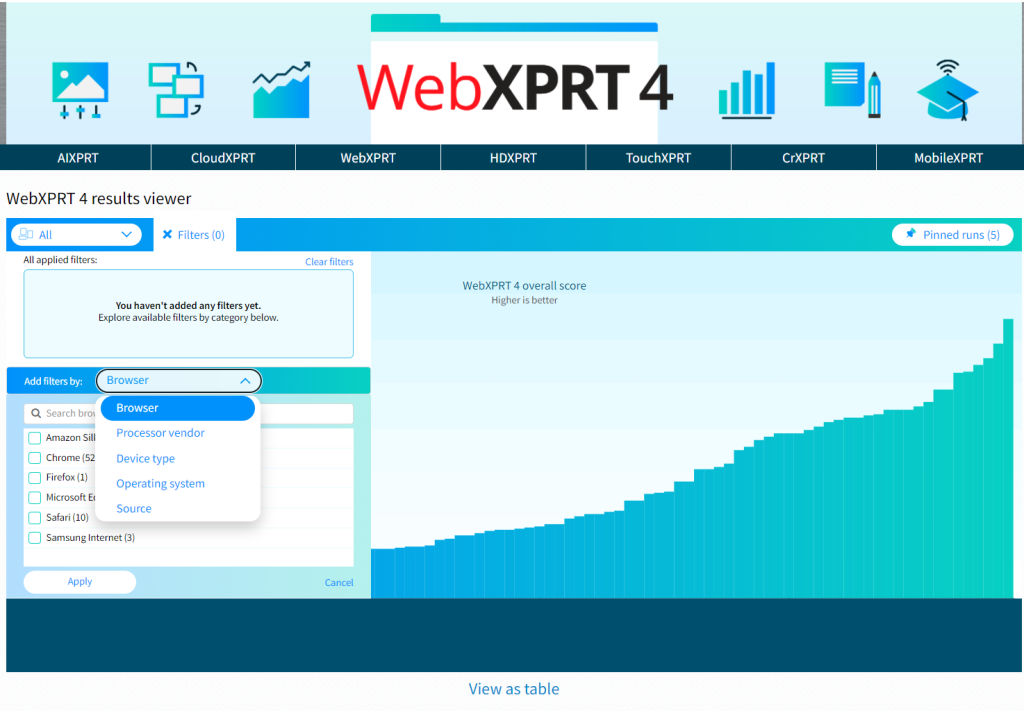
The screenshot below shows the tool’s default display. In this example, the viewer displays over 650 sample results—from a wide range of device types—that we’re currently using as placeholder data. The viewer will include several sorting and filtering options, such as device type, hardware specs such as browser type and processor vendor, the source of the result, etc.

Each vertical bar in the graph represents the overall score of single test result, and the graph presents the scores in order from lowest to highest. To view an individual result in detail, the user simply hovers over and selects the bar representing the result. The bar turns dark blue, and the dark blue banner at the bottom of the viewer displays details about that result.

In the example above, the banner shows the overall score (250) and the score’s percentile rank (85th) among the scores in the current display. In the final version of the viewer, the banner will also display the device name of the test system, along with basic hardware disclosure information. Selecting the Run details button will let users see more about the run’s individual workload scores.

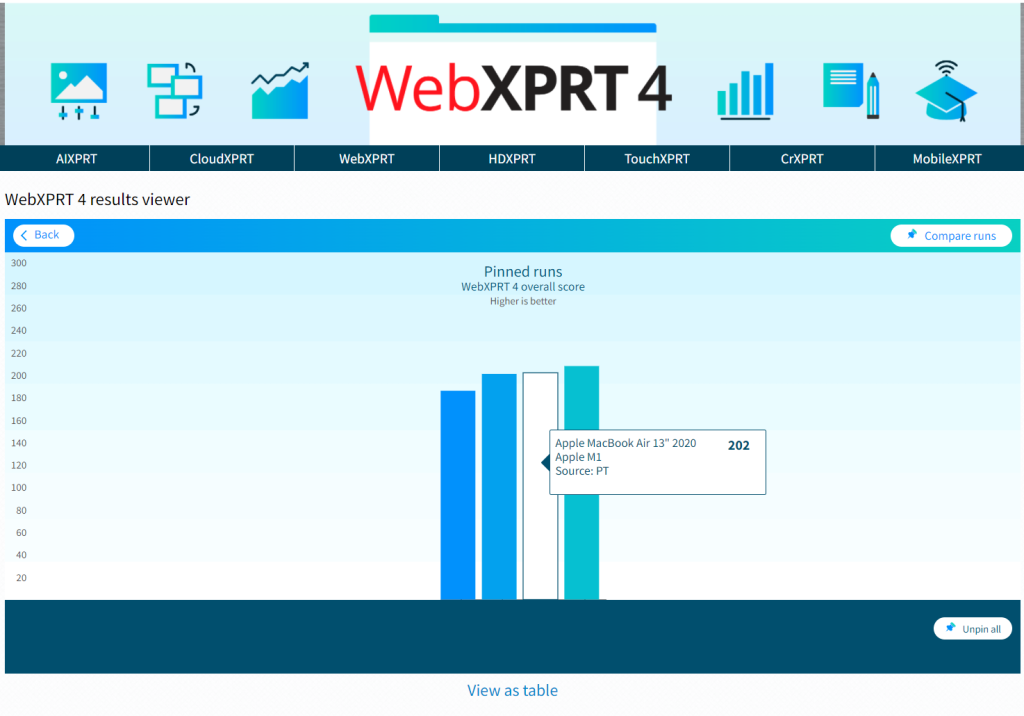
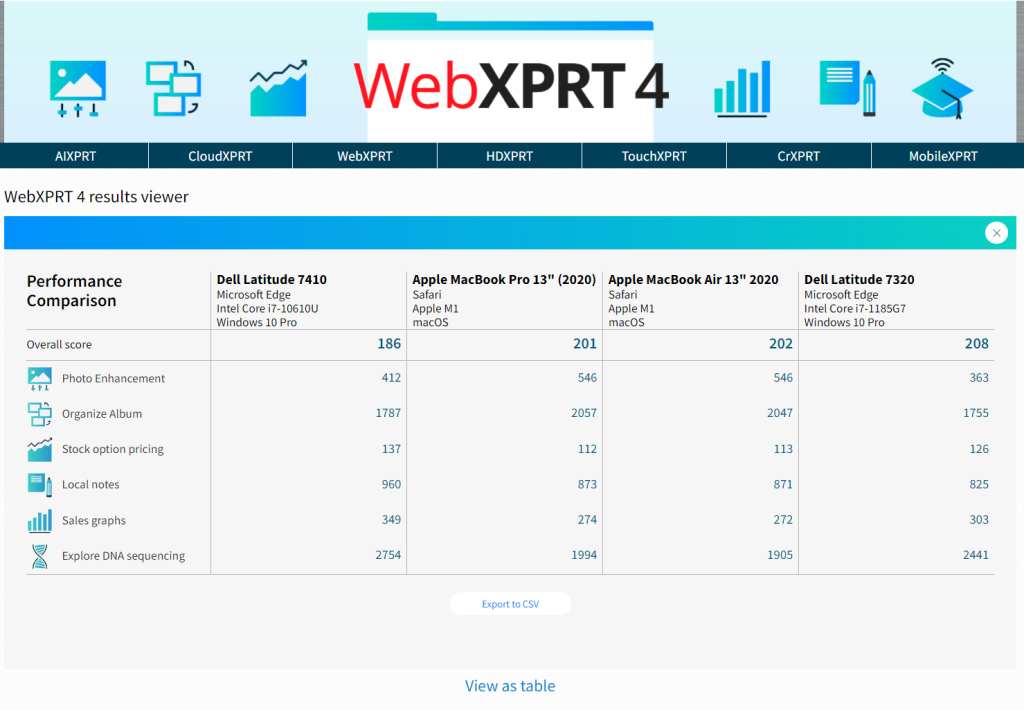
We’re still working on a way for users to pin or save specific runs. This would let users easily find the results that interest them, or possibly select multiple runs for a side-by-side comparison.

We’re excited about this new tool, and we look forward to sharing more details here in the blog as we get closer to taking it live. If you have any questions or comments about the results viewer, please feel free to contact us!

Justin

Check out the other XPRTs:

Forgot your password?