BenchmarkXPRT Blog banner

Category: WebXPRT

How to submit results for the WebXPRT Processor Comparison Chart

The WebXPRT 2015 Processor Comparison Chart is in its second month, and we’re excited to see that people are browsing the scores. We’re also starting to receive more WebXPRT score submissions for publication, so we thought it would be a good time to describe how that process works.

Unlike sites that publish any results they receive, we hand-select results from internal lab testing, end-of-test user submissions, and reliable tech media sources. In each case, we evaluate whether the score is consistent with general expectations. For sources outside of our lab, that evaluation includes checking to see whether there is enough detailed system information to get a sense of whether the score makes sense. We do this for every score on the WebXPRT results page and the general XPRT results page.

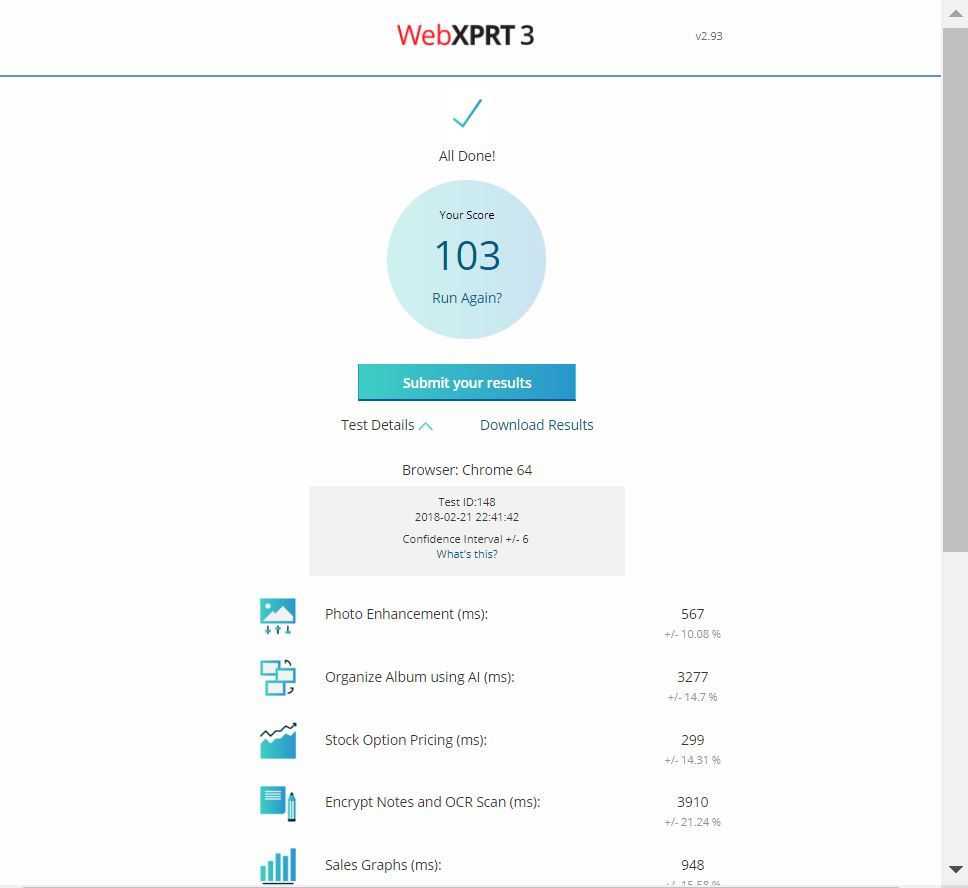
If we decide to publish a WebXPRT result, that score automatically appears in the processor comparison chart as well. If you would like to submit your score, the submission process is quick and easy. At the end of the WebXPRT test run, click the Submit button below the individual workload scores, complete the short submission form, and click Submit again. The screenshot below shows how the form would look if I submitted a score at the end of a WebXPRT run on my personal system.

WebXPRT results submission

After you submit your score, we’ll contact you to confirm the name we should display as the source for the data. You can use one of the following:

  • Your first and last name
  • “Independent tester,” if you wish to remain anonymous
  • Your company’s name, provided that you have permission to submit the result in their name. If you want to use a company name, we ask that you provide your work email address.


We will not publish any additional information about you or your company without your permission.

We look forward to seeing your score submissions, and if you have suggestions for the processor chart or any other aspect of the XPRTs, let us know!

Justin

Glimpses of the next WebXPRT

Development work on the next version of WebXPRT is well underway, and we think it’s a good time to offer a glimpse of what’s to come.

We’ve updated the photo-related workloads with new images and are experimenting with adding a new task to the Organize Album workload. The task utilizes ConvNetJS, a JavaScript library designed for training neural networks within the browser itself, to assign classifications to a set of images. It’s an example of the type of integrated deep learning tasks that will be showing up in all sorts of devices in the years to come.

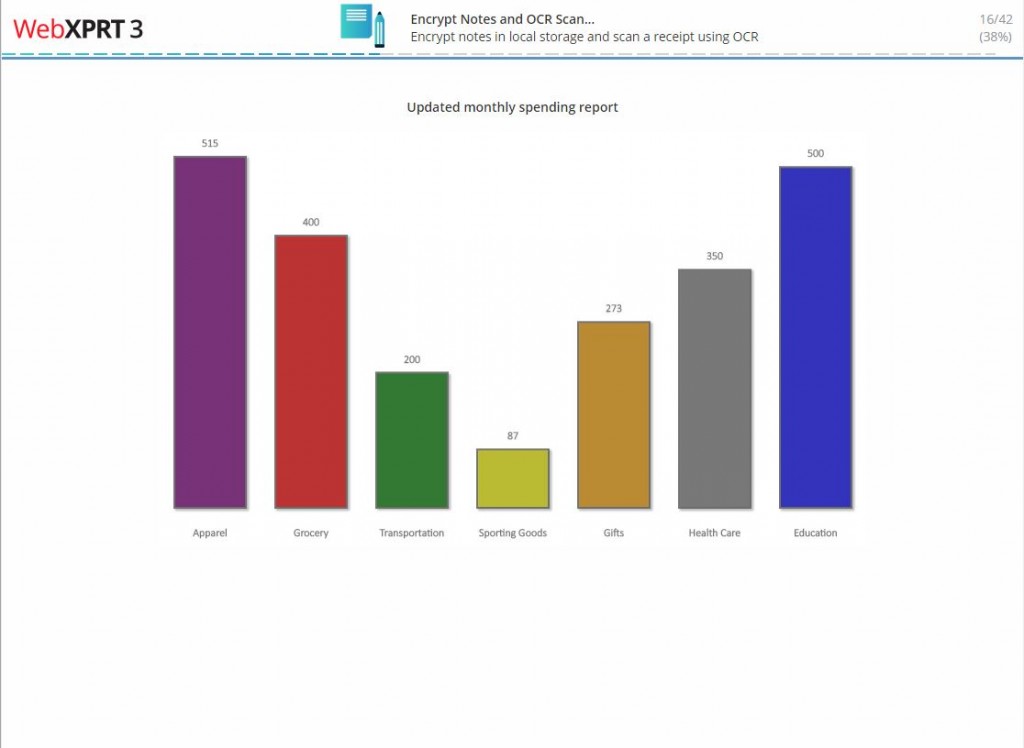
We’re also testing an additional task in the Local Notes workload using Tesseract.js, a popular OCR (optical character recognition) engine. Our scenario uses OCR technology to scan images of purchase receipts and gather relevant information.

We’re testing these new tasks now, and will include them only once we’re confident that they produce consistent and reliable results without extending the benchmark’s runtime unnecessarily.  Consequently, the next WebXPRT might contain variations of these tasks, or other new technologies altogether. We mention them now to offer some insight into the types of workload enhancements that we’re considering.

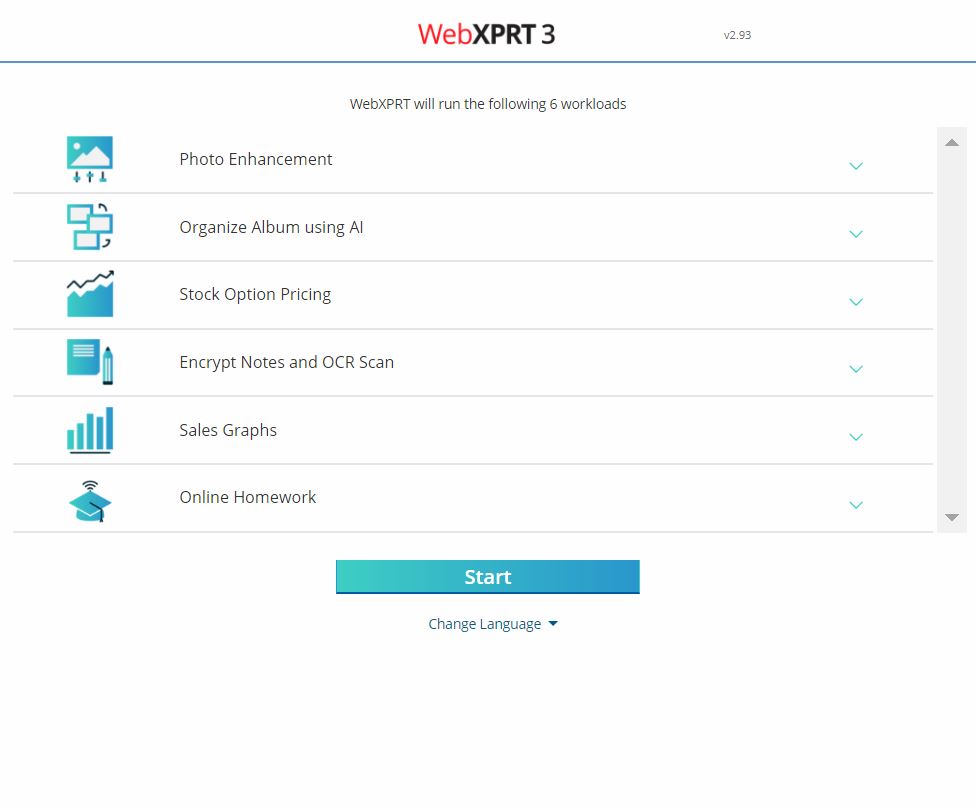
We’ve been working hard on the new WebXPRT UI as well. The image below shows the new start page from an early development build. We’re still making adjustments, so the final product will probably differ, but you do get a sense of the new UI’s clean look.

WebXPRT screen shot

As we’ve said before, we’re committed to making sure that WebXPRT runs in most browsers and produces results that are useful for comparing web browsing performance across a wide variety of devices. We appreciate the feedback we’ve gotten so far, and are happy to receive more. Do you have ideas for the next WebXPRT? Let us know!

Justin

Looking for performance clues

We’ve written before about how the operating system and other software can influence test scores and even battery life. Benchmarks like the XPRTs provide overall results, but teasing out which factors affect those results may require some detective work. The key is to collect individual data points as evidence to what may be causing performance changes.

The Apple iOS 11 rollout last month is an excellent example of the effect of software on device performance. Angry tweets started almost immediately after the update, claiming that iOS 11 drained device batteries. iPhone users here at PT experienced similar issues. What was the cause of that performance drop? The hardware remained the same. So, did software cause the problem?

Less than a week after the rollout, Mashable published an explanation of possible causes. The article quotes research from mobile security firm Wandera showing that, for the 50,000 “moderate to heavy iPhone and iPad users” in the study, devices running iOS 11 burned through their battery at much faster rates than the same devices running iOS 10. They cite two possible causes:

    • devices often re-categorize the files stored on them for every new OS install, which may account for some of the battery issues.
    • many apps are not optimized for iOS 11 yet.


While these explanations make sense, with a little more digging, we could get closer to actually solving the mystery instead of guessing at the causes. After all, it is also possible that people are using iOS 11 differently from iOS 10. So, how could a dedicated sleuth investigate further? Anyone using benchmarks and hands-on testing to sift through various scenarios and configurations could get us closer to solving this mystery and any other software-based performance anomalies. But it’s a daunting task—changing only one variable at a time and recording the results is like pounding the streets and knocking on doors to solve a case.

In all likelihood, some combination of Apple iOS updates and application changes will improve the battery life for iOS 11. In the meantime, we wish we had an XPRT that could test battery life on iOS. Who knows, maybe some future version of WebXPRT will be able to help in future sleuthing.

Eric

Introducing the WebXPRT 2015 Processor Comparison Chart

Today, we’re excited to announce the WebXPRT 2015 Processor Comparison Chart, a new tool that makes it easier to access hundreds of PT-curated, real-world performance scores from a wide range of devices covering everything from TVs to phones to tablets to PCs.

The chart offers a quick way to browse and compare WebXPRT 2015 results grouped by processor. Unlike benchmark-score charts that may contain results from unknown sources, PT hand-selected each of the results from internal lab testing and reliable tech media sources. If we published multiple scores for an individual processor, the score presented in the chart will be an average of those scores. Users can hover over and click individual score bars for additional information about the test results and test sources for each processor.

WebXPRT proc chart capture

We think the WebXPRT Processor Comparison Chart will be a valuable resource for folks interested in performance testing and product evaluation, but the current iteration is only the beginning. We plan to add additional capabilities on a regular basis, such a detailed filtering and enhanced viewing and navigational options. It’s also possible that we may integrate other XPRT benchmarks down the road.

Most importantly, we want the chart to be a great asset for its users, and that’s where you come in. We’d love to hear your feedback on the features and types of data you’d like to see. If you have suggestions, please let us know!

Justin

Decisions, decisions

Back in April, we shared some of our initial ideas for a new version of WebXPRT, and work on the new benchmark is underway. Any time we begin the process of updating one of the XPRT benchmarks, one of the first decisions we face is how to improve workload content so it better reflects the types of technology average consumers use every day. Since benchmarks typically have a life cycle of two to four years, we want the benchmark to be relevant for at least the next couple of years.

For example, WebXPRT contains two photo-related workloads, Photo Effects and Organize Album. Photo Effects applies a series of effects to a set of photos, and Organize Album uses facial recognition technology to analyze a set of photos. In both cases, we want to use photos that represent the most relevant combination of image size, resolution, and data footprint possible. Ideally, the resulting image sizes and resolutions should differentiate processing speed on the latest systems, but not at the expense of being able to run reasonably on most current devices. We also have to confirm that the photos aren’t so large as to impact page load times unnecessarily.

The way this strategy works in practice is that we spend time researching hardware and operating system market share. Given that phones are the cameras that most people use, we look at them to help define photo characteristics. In 2017, the most widespread mobile OS is Android, and while reports vary depending on the metric used, the Samsung Galaxy S5 and Galaxy S7 are at or near the top of global mobile market share. For our purposes, the data tells us that choosing photo sizes and resolutions that mirror those of the Galaxy line is a good start, and a good chunk of Android users are either already using S7-generation technology, or will be shifting to new phones with that technology in the coming year. So, for the next version of WebXPRT, we’ll likely use photos that represent the real-life environment of an S7 user.

I hope that provides a brief glimpse into the strategies we use to evaluate workload content in the XPRT benchmarks. Of course, since the BenchmarkXPRT Development Community is an open development community, we’d love to hear your comments or suggestions!

Justin

WebXPRT and user-agent strings

After running WebXPRT in Microsoft Edge, a tester recently asked why the browser information field on the results page displayed “Chrome 52 – Edge 15.15063.” It’s a good question; why would the benchmark report Chrome 52 when Microsoft Edge is the browser under test? The answer lies in understanding user-agent strings and the way that WebXPRT gathers specific bits of information.

When browsers request a web page from a hosting server, they send an array of basic header information that allows the server to determine the client’s capabilities and the best way to provide the requested content. One of these headers, the user-agent, presents a string of tokens that provide information about the application making the request, the operating system and version, rendering engine compatibility, and browser platform details. In effect, the user-agent string is a way for a browser to tell the hosting server the full extent of its capabilities.

When WebXPRT attempts to identify a browser, it references the browser token in the user-agent string.

The process is generally straightforward, but in some cases, browsers spoof information from other browsers in their user-agent strings, which makes accurate browser detection difficult. The reasons for this are complex, but they involve web development practices and the fact that some web pages are not designed to recognize and work well with new or less-popular browsers. When we released WebXPRT 2015, Microsoft Edge was new. The Edge team wanted to make sure that as much advanced web content as possible would be available to Edge users, so they created a user-agent string that declared itself to be several different browsers at once.

I can see this in action if I check Edge’s user-agent string on my system. Currently, it reports “Mozilla/5.0 (Windows NT 10.0; Win64; x64; ServiceUI 9) AppleWebKit/537.36 (KHTML, like Gecko) Chrome/52.0.2743.116 Safari/537.36 Edge/15.15063.” So, because of the way Edge’s user-agent string is constructed, and the way WebXPRT parses that information, the browser information field on WebXPRT’s results page will report “Chrome 52 – Edge 15.15063” on my system.

To try this on your system, in Edge, select the ellipses icon in the top right-hand corner, then F12 Developer Tools. Next, select the Console tab, and run “javascript:alert(navigator.userAgent).” A popup window will display the UA string.

You can find instructions for finding the user-agent string in other browsers here: http://techdows.com/2016/07/edge-ie-chrome-firefox-user-agent-strings.html.

In the next version of WebXPRT, we’ll work to refine the way that the test parses user-agent strings, and provide more accurate system information for testers. If you have any questions or suggestions regarding this topic, let us know!

Justin

Check out the other XPRTs:

Forgot your password?