BenchmarkXPRT Blog banner

Category: WebXPRT

The Exploring WebXPRT 3 white paper is now available

Today, we published the Exploring WebXPRT 3 white paper. The paper describes the differences between WebXPRT 3 and WebXPRT 2015, including changes we made to the harness and the structure of the six performance test workloads. We also explain the benchmark’s scoring methodology, how to automate tests, and how to submit results for publication. Readers will also find additional detail about the third-party functions and libraries that WebXPRT uses during the HTML5 capability checks and performance workloads.

Because data collection and privacy concerns are more relevant than ever, we also discuss the WebXPRT data collection mechanisms and our commitment to respecting testers’ privacy. Finally, for readers who may be unfamiliar with the XPRTs, we describe the other benchmark tools in the XPRT family, the role of the BenchmarkXPRT Development Community, and how you can contribute to the XPRTs.

Along with the WebXPRT 3 results calculation white paper and spreadsheet, the Exploring WebXPRT 3 white paper is designed to promote the high level of transparency and disclosure that is a core value of the BenchmarkXPRT Development Community. Both WebXPRT white papers and the results calculation spreadsheet are available on WebXPRT.com and on our XPRT white papers page. If you have any questions about the WebXPRT, please let us know, and be sure to check out our other XPRT white papers.

Justin

Which browser is the fastest? It’s complicated.

PCWorld recently published the results of a head-to-head browser performance comparison between Google Chrome, Microsoft Edge, Mozilla Firefox, and Opera. As we’ve noted about similar comparisons, no single browser was the fastest in every test. Browser speed sounds like a straightforward metric, but the reality is complex.

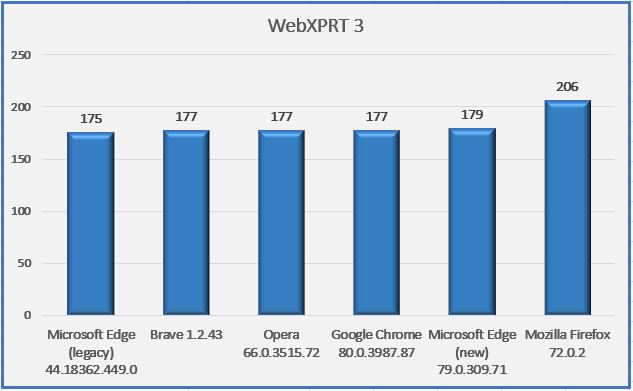
For the comparison, PCWorld used three JavaScript-centric test suites (JetStream, SunSpider, and Octane), one benchmark that simulates user actions (Speedometer), a few in-house tests of their own design, and one benchmark that simulates real-world web applications (WebXPRT). Edge came out on top in JetStream and SunSpider, Opera won in Octane and WebXPRT, and Chrome had the best results in Speedometer and PCWorld’s custom workloads.

The reason that the benchmarks rank the browsers so differently is that each one has a unique emphasis and tests a specific set of workloads and technologies. Some focus on very low-level JavaScript tasks, some test additional technologies such as HTML5, and some are designed to identify strengths or weakness by stressing devices in unusual ways. These approaches are all valid, and it’s important to understand exactly what a given score represents. Some scores reflect a very broad set of metrics, while others assess a very narrow set of tasks. Some scores help you to understand the performance you can expect from a device in your everyday life, and others measure performance in scenarios that you’re unlikely to encounter. For example, when Eric discussed a similar topic in the past, he said the tests in JetStream 1.1 provided information that “can be very useful for engineers and developers, but may not be as meaningful to the typical user.”

As we do with all the XPRTs, we designed WebXPRT to test how devices handle the types of real-world tasks consumers perform every day. While lab techs, manufacturers, and tech journalists can all glean detailed data from WebXPRT, the test’s real-world focus means that the overall score is relevant to the average consumer. Simply put, a device with a higher WebXPRT score is probably going to feel faster to you during daily use than one with a lower score. In today’s crowded tech marketplace, that piece of information provides a great deal of value to many people.

What are your thoughts on browser testing? We’d love to hear from you.

Justin

WebXPRT passes another milestone!

We’re excited to see that users have successfully completed over 250,000 WebXPRT runs! From the original WebXPRT 2013 to the most recent version, WebXPRT 3, this tool has been popular with manufacturers, developers, consumers, and media outlets around the world because it’s easy to run, it runs quickly and on a wide variety of platforms, and it evaluates device performance using real-world tasks.

If you’ve run WebXPRT in any of the more than 458 cities and 64 countries from which we’ve received complete test data—including newcomers Lithuania, Luxembourg, Sweden, and Uruguay—we’re grateful for your help in reaching this milestone. Here’s to another quarter-million runs!

If you haven’t yet transitioned your browser testing to WebXPRT 3, now is a great time to give it a try! WebXPRT 3 includes updated photo workloads with new images and a deep learning task used for image classification. It also uses an optical character recognition task in the Encrypt Notes and OCR scan workload and combines part of the DNA Sequence Analysis scenario with a writing sample/spell check scenario to simulate online homework in the new Online Homework workload. Users carry out tasks like these on their browsers daily, making these workloads very effective for assessing how well a device will perform in the real world.

Happy testing to everyone, and if you have any questions about WebXPRT 3 or the XPRTs in general, feel free to ask!

Justin

The WebXPRT 3 results calculation white paper is now available

As we’ve discussed in prior blog posts, transparency is a core value of our open development community. A key part of being transparent is explaining how we design our benchmarks, why we make certain development decisions, and how the benchmarks actually work. This week, to help WebXPRT 3 testers understand how the benchmark calculates results, we published the WebXPRT 3 results calculation and confidence interval white paper.

The white paper explains what the WebXPRT 3 confidence interval is, how it differs from typical benchmark variability, and how the benchmark calculates the individual workload scenario and overall scores. The paper also provides an overview of the statistical techniques WebXPRT uses to translate raw times into scores.

To supplement the white paper’s overview of the results calculation process, we’ve also published a spreadsheet that shows the raw data from a sample test run and reproduces the calculations WebXPRT uses.

The paper and spreadsheet are both available on WebXPRT.com and on our XPRT white papers page. If you have any questions about the WebXPRT results calculation process, please let us know, and be sure to check out our other XPRT white papers.

Justin

More on the way for the XPRT Weekly Tech Spotlight

In the coming months, we’ll continue to add more devices and helpful features to the XPRT Weekly Tech Spotlight. We’re especially interested in adding data points and visual aids that make it easier to quickly understand the context of each device’s test scores. For instance, those of us who are familiar with WebXPRT 3 scores know that an overall score of 250 is pretty high, but site visitors who are unfamiliar with WebXPRT probably won’t know how that score compares to scores for other devices.

We designed Spotlight to be a source of objective data, in contrast to sites that provide subjective ratings for devices. As we pursue our goal of helping users make sense of scores, we want to maintain this objectivity and avoid presenting information in ways that could be misleading.

Introducing comparison aids to the site is forcing us to make some tricky decisions. Because we value input from XPRT community members, we’d love to hear your thoughts on one of the questions we’re facing: How should our default view present a device’s score?

We see three options:

1) Present the device’s score in relation to the overall high and low scores for that benchmark across all devices.
2) Present the device’s score in relation to the overall high and low scores for that benchmark across the broad category of devices to which that device belongs (e.g., phones).
3) Present the device’s score in relation to the overall high and low scores for that benchmark across a narrower sub-category of devices to which that device belongs (e.g., high-end flagship phones).

To think this through, consider WebXPRT, which runs on desktops, laptops, phones, tablets, and other devices. Typically, the WebXPRT scores for phones and tablets are lower than scores for desktop and laptop systems. The first approach helps to show just how fast high-end desktops and laptops handle the WebXPRT workloads, but it could make a phone or tablet look slow, even if its score was good for its category. The second approach would prevent unfair default comparisons between different device types but would still present comparisons between devices that are not true competitors (e.g., flagship phones vs. budget phones). The third approach is the most careful, but would introduce an element of subjectivity because determining the sub-category in which a device belongs is not always clear cut.

Do you have thoughts on this subject, or recommendations for Spotlight in general? If so, Let us know.

Justin

The value of speed

I was reading an interesting article on how high-end smartphones like the iPhone X, Pixel 2 XL, and Galaxy S8 generate more money from in-game revenue than cheaper phones do.

One line stood out to me: “With smartphones becoming faster, larger and more capable of delivering an engaging gaming experience, these monetization key performance indicators (KPIs) have begun to increase significantly.”

It turns out the game companies totally agree with the rest of us that faster devices are better!

Regardless of who is seeking better performance—consumers or game companies—the obvious question is how you determine which models are fastest. Many folks rely on device vendors’ claims about how much faster the new model is. Unfortunately, the vendors’ claims don’t always specify on what they base the claims. Even when they do, it’s hard to know whether the numbers are accurate and applicable to how you use your device.

The key part of any answer is performance tools that are representative, dependable, and open.

  • Representative – Performance tools need to have realistic workloads that do things that you care about.
  • Dependable – Good performance tools run reliably and produce repeatable results, both of which require that significant work go into their development and testing.
  • Open – Performance tools that allow people to access the source code, and even contribute to it, keep things above the table and reassure you that you can rely on the results.

Our goal with the XPRTs is to provide performance tools that meet all these criteria. WebXPRT 3 and all our other XPRTs exist to help accurately reveal how devices perform. You can run them yourself or rely on the wealth of results that we and others have collected on a wide array of devices.

The best thing about good performance tools is that everyone, even vendors, can use them. I sincerely hope that you find the XPRTs helpful when you make your next technology purchase.

Bill

Check out the other XPRTs:

Forgot your password?