Over the last few weeks, we’ve been excited to see steady growth in the number of people running the WebXPRT 5 Preview—as well as how widely distributed those runs are around the world. To get a picture of WebXPRT’s approximate global reach, we run the IP address data from our database through a program that provides general city- and country-level location information. By tallying that location data, we can better understand where people are running WebXPRT. By the way, this is the most detailed information we have, and all test data will remain completely anonymous unless you submit it for publication.
Based on that info—along with direct feedback from users—we’ve determined that OEM labs, tech press journalists, and individual consumers have already run the WebXPRT 5 Preview in more than 125 cities across 35 countries!
Test run data is just one of the ways that we track the progress we’re making toward our goal of providing all interested parties with benchmark tools that are reliable, relevant, and free to use. Another important way we track progress toward that goal is by paying attention to how much people use and discuss the XPRTs. When the name of one of our apps appears in an ad, article, or tech review, we call it a “mention.” Tracking those kinds of mentions helps us gauge our reach.
From time to time, we like to share a sample of recent XPRT mentions here in the blog. If you just started following the XPRTs, it may be surprising to see our global reach. Whether you’re a new visitor to the XPRT blog or a longtime reader, we hope you’ll enjoy exploring the links below!
Recent mentions include:
- eTeknix used the WebXPRT 5 Preview in an in-depth YouTube video review of the AMD Ryzen 7 9850X3D processor.
- Laptop Mag used WebXPRT 4 to generate data for an article titled, I found the 6 best touchscreen laptops for college, work, and creative pros—lab-tested and expert-reviewed.
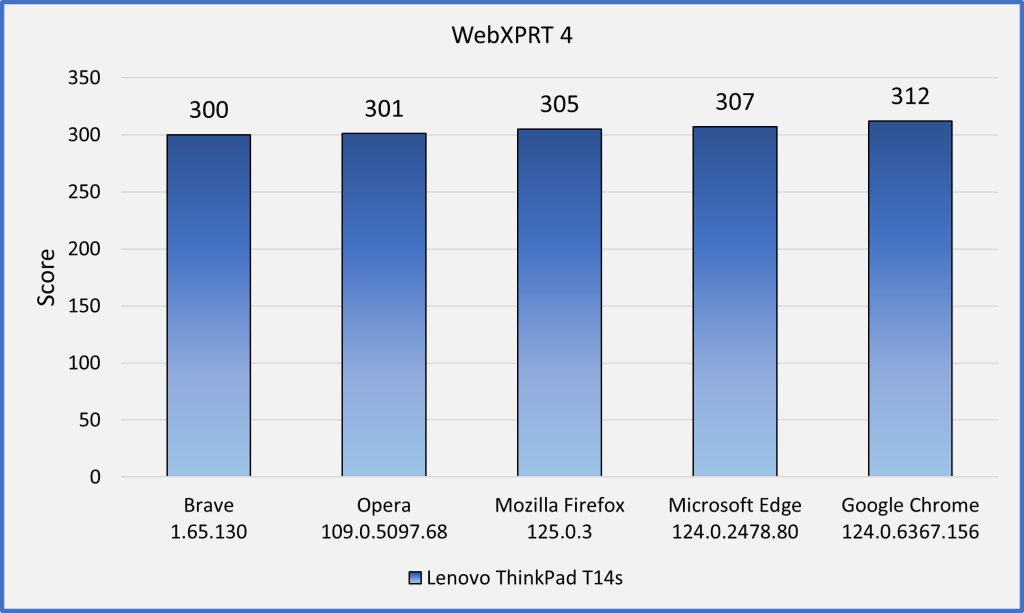
- Microsoft’s Windows Performance Lab published a range of benchmark results that included WebXPRT 4 scores for the ASUS Vivobook S14 and a selection of Lenovo laptops.
- Notebookcheck used WebXPRT 4 in dozens of device reviews, including evaluations of the ASUS ExpertBook Ultra, Dell Pro Max 18 Plus, HP ZBook Fury G1i 18, and Lenovo ThinkPad X1 Carbon Gen 13, and Samsung Galaxy Tab A11+.
- PCMag used WebXPRT in an evaluation of the Acer Chromebook Mini CXM1 and an article comparing Chrome and Firefox browser performance.
- PCWorld used WebXPRT 4 to review the ASUS Chromebook Plus CX14.
- Tom’s Guide used WebXPRT 4 in a review of the Acer Chromebook CX515.
- Other outlets that have published articles, ads, or reviews mentioning the XPRTs in the last few months include the following: 3DNews.ru (Russia), About Chromebooks, Acer, Alza.hu (Hungary), BenchLife.info (China), Best Buy, CNET, ComputerBase (Germany), Dell, DGL.RU (Russia), Expert Reviews, Intel, ITC.ua (Ukraine), Komputronik (Poland), PConline.com (China), QQ News (China), The Tech Revolutionist, TechRadar, and Tweakers, among many others.
If you’d like to receive monthly updates on XPRT-related news and activity, we encourage you to sign up for our XPRT newsletter. It’s completely free, and all you need to do to join the newsletter mailing list is let us know! We won’t publish, share, or sell any of the contact information you provide, and we’ll only send you the monthly newsletter and occasional benchmark-related announcements, such as important news about patches or releases.
If you have any questions about the WebXPRT 5 Preview or the XPRTs in general, please feel free to contact us.
Justin