BenchmarkXPRT Blog banner

Category: Browser-based benchmarks

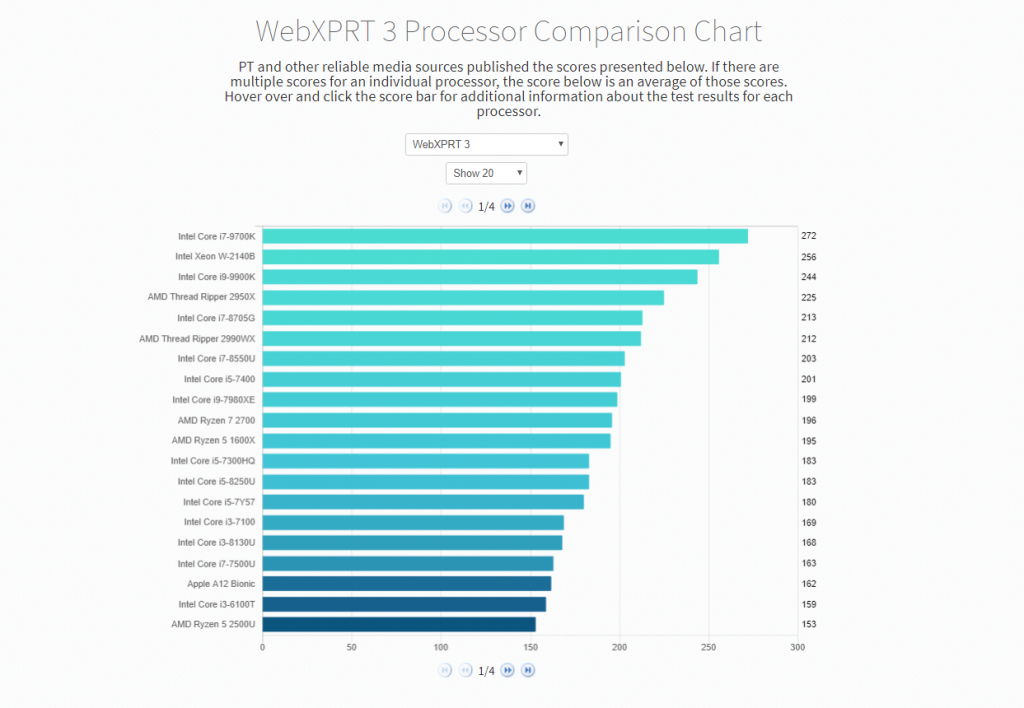
New features for the WebXPRT Processor Comparison Chart

We’re excited that the WebXPRT 2015 Processor Comparison Chart is becoming a valuable resource for community members and visitors interested in comparing web-browsing performance scores. When we introduced the chart, we mentioned that the first iteration was only the beginning. We planned to add additional capabilities on a regular basis, and today we’re happy to announce some new features.

The chart now offers a drop-down menu for displaying more than 20 results per page. (You can choose 20, 50, 100, or all.) When you click on a system to view the details of its score, you will see that we added a column displaying browser information. If the “Browser” column entry shows as “Unknown,” this means we can’t find browser information for a specific test result.

We’re also working on adding a drop-down menu for filtering scores by device type (laptop, tablet, etc.).

We hope these features will prove to be helpful. We want the chart to continue to be a great asset for its users, so if you have ideas for features and types of data you’d like to see, let us know!

Justin

The WebXPRT 3 Community Preview is here!

Today we’re releasing the WebXPRT 3 Community Preview (CP). As we discussed in the blog last month, in the new version of WebXPRT, we updated the photo-related workloads with new images and a new deep learning task for the Organize Album workload. We also added an optical character recognition task to the Local Notes workload and combined a portion of the DNA Sequence Analysis scenario with a writing sample/spell check scenario to simulate an online homework hub in the new “Online Homework” workload.

Also, longtime WebXPRT users will immediately notice a completely new, but clean and straightforward, UI. We’re still tweaking aspects of the UI and implementing full functionality for certain features such as social media sharing and German language translation, but we don’t anticipate making any significant changes to the overall test or individual workloads before the general release.

As with all community previews, the WebXPRT 3 CP is available only to BenchmarkXPRT Development Community members, who can access the link from the WebXPRT tab in the Members’ Area.

After you try the WebXPRT 3 CP, please send us your comments. Thanks and happy testing!

Justin

News about WebXPRT and BatteryXPRT

Last month, we gave readers a glimpse of the updates in store for the next WebXPRT, and now we have more news to report on that front.

The new version of WebXPRT will be called WebXPRT 3. WebXPRT 3 will retain the convenient features that made WebXPRT 2013 and WebXPRT 2015 our most popular tools, with more than 200,000 combined runs to date. We’ve added new elements, including AI, to a few of the workloads, but the test will still run in 15 minutes or less in most browsers and produce the same easy-to-understand results that help compare browsing performance across a wide variety of devices.

We’re also very close to publishing the WebXPRT 3 Community Preview. For those unfamiliar with our open development community model, BenchmarkXPRT Development Community members have the ability to preview and test new benchmark tools before we release them to the general public. Community previews are a great way for members to evaluate new XPRTs and send us feedback. If you’re interested in joining, you can register here.

In BatteryXPRT news, we recently started to see unusual battery life estimates and high variance when running battery life tests at the default length of 5.25 hours. We think this may be due to changes in how new OS versions are reporting battery life on certain devices, but we’re in the process of extensive testing to learn more. In the meantime, we recommend that BatteryXPRT users adjust the test run time to allow for a full rundown.

Do you have questions or comments about WebXPRT or BatteryXPRT? Let us know!

Justin

How to submit results for the WebXPRT Processor Comparison Chart

The WebXPRT 2015 Processor Comparison Chart is in its second month, and we’re excited to see that people are browsing the scores. We’re also starting to receive more WebXPRT score submissions for publication, so we thought it would be a good time to describe how that process works.

Unlike sites that publish any results they receive, we hand-select results from internal lab testing, end-of-test user submissions, and reliable tech media sources. In each case, we evaluate whether the score is consistent with general expectations. For sources outside of our lab, that evaluation includes checking to see whether there is enough detailed system information to get a sense of whether the score makes sense. We do this for every score on the WebXPRT results page and the general XPRT results page.

If we decide to publish a WebXPRT result, that score automatically appears in the processor comparison chart as well. If you would like to submit your score, the submission process is quick and easy. At the end of the WebXPRT test run, click the Submit button below the individual workload scores, complete the short submission form, and click Submit again. The screenshot below shows how the form would look if I submitted a score at the end of a WebXPRT run on my personal system.

WebXPRT results submission

After you submit your score, we’ll contact you to confirm the name we should display as the source for the data. You can use one of the following:

  • Your first and last name
  • “Independent tester,” if you wish to remain anonymous
  • Your company’s name, provided that you have permission to submit the result in their name. If you want to use a company name, we ask that you provide your work email address.


We will not publish any additional information about you or your company without your permission.

We look forward to seeing your score submissions, and if you have suggestions for the processor chart or any other aspect of the XPRTs, let us know!

Justin

Glimpses of the next WebXPRT

Development work on the next version of WebXPRT is well underway, and we think it’s a good time to offer a glimpse of what’s to come.

We’ve updated the photo-related workloads with new images and are experimenting with adding a new task to the Organize Album workload. The task utilizes ConvNetJS, a JavaScript library designed for training neural networks within the browser itself, to assign classifications to a set of images. It’s an example of the type of integrated deep learning tasks that will be showing up in all sorts of devices in the years to come.

We’re also testing an additional task in the Local Notes workload using Tesseract.js, a popular OCR (optical character recognition) engine. Our scenario uses OCR technology to scan images of purchase receipts and gather relevant information.

We’re testing these new tasks now, and will include them only once we’re confident that they produce consistent and reliable results without extending the benchmark’s runtime unnecessarily.  Consequently, the next WebXPRT might contain variations of these tasks, or other new technologies altogether. We mention them now to offer some insight into the types of workload enhancements that we’re considering.

We’ve been working hard on the new WebXPRT UI as well. The image below shows the new start page from an early development build. We’re still making adjustments, so the final product will probably differ, but you do get a sense of the new UI’s clean look.

WebXPRT screen shot

As we’ve said before, we’re committed to making sure that WebXPRT runs in most browsers and produces results that are useful for comparing web browsing performance across a wide variety of devices. We appreciate the feedback we’ve gotten so far, and are happy to receive more. Do you have ideas for the next WebXPRT? Let us know!

Justin

Introducing the WebXPRT 2015 Processor Comparison Chart

Today, we’re excited to announce the WebXPRT 2015 Processor Comparison Chart, a new tool that makes it easier to access hundreds of PT-curated, real-world performance scores from a wide range of devices covering everything from TVs to phones to tablets to PCs.

The chart offers a quick way to browse and compare WebXPRT 2015 results grouped by processor. Unlike benchmark-score charts that may contain results from unknown sources, PT hand-selected each of the results from internal lab testing and reliable tech media sources. If we published multiple scores for an individual processor, the score presented in the chart will be an average of those scores. Users can hover over and click individual score bars for additional information about the test results and test sources for each processor.

WebXPRT proc chart capture

We think the WebXPRT Processor Comparison Chart will be a valuable resource for folks interested in performance testing and product evaluation, but the current iteration is only the beginning. We plan to add additional capabilities on a regular basis, such a detailed filtering and enhanced viewing and navigational options. It’s also possible that we may integrate other XPRT benchmarks down the road.

Most importantly, we want the chart to be a great asset for its users, and that’s where you come in. We’d love to hear your feedback on the features and types of data you’d like to see. If you have suggestions, please let us know!

Justin

Check out the other XPRTs:

Forgot your password?