BenchmarkXPRT Blog banner

Category: Performance benchmarking

The XPRTs are a great back-to-school shopping resource

Students of all ages will be starting a new school year over the next few weeks, and many learners will be shopping for tech devices that can help them excel in their studies. The tech marketplace can be confusing, and competing claims can be hard to navigate. The XPRTs are here to help! Whether you’re shopping for a new laptop, desktop, Chromebook, tablet, or phone, the XPRTs can provide reliable, industry-trusted performance scores that can cut through all the noise.

A good place to start looking for scores is the WebXPRT 4 results viewer. The viewer displays WebXPRT 4 scores from almost 500 devices—including many hot new releases—and we’re adding new scores all the time. To learn more about the viewer’s capabilities and how you can use it to compare devices, check out this blog post.

Another resource we offer is the XPRT results browser. The browser is the most efficient way to access the XPRT results database, which currently holds more than 3,400 test results from over 140 sources, including major tech review publications around the world, OEMs, and independent testers. It offers a wealth of current and historical performance data across all of the XPRT benchmarks and hundreds of devices. You can read more about how to use the results browser here.

Also, if you’re considering a popular device, chances are good that a recent tech review includes an XPRT score for that device. Two quick ways to find these reviews: (1) go to your favorite tech review site and search for “XPRT” and (2) go to a search engine and enter the device name and XPRT name (e.g. “Lenovo ThinkPad” and “WebXPRT”). Here are a few recent tech reviews that use one of the XPRTs to evaluate a popular device:

The XPRTs can help back-to-school shoppers make better-informed and more confident tech purchases. As this school year begins, we hope you’ll find the data you need on our site or in an XPRT-related tech review. If you have any questions about the XPRTs, XPRT scores, or the results database please feel free to ask!

Justin

Check out the WebXPRT 4 results viewer

New visitors to our site may not be aware of the WebXPRT 4 results viewer and how to use it. The viewer provides WebXPRT 4 users with an interactive, information-packed way to browse test results that is not available for earlier versions of the benchmark. With the viewer, users can explore all of the PT-curated results that we’ve published on WebXPRT.com, find more detailed information about those results, and compare results from different devices. The viewer currently displays over 460 results, and we add new entries each week.

The screenshot below shows the tool’s default display. Each vertical bar in the graph represents the overall score of a single test result, with bars arranged from lowest to highest. To view a single result in detail, the user hovers over a bar until it turns white and a small popup window displays the basic details of the result. If the user clicks to select the highlighted bar, the bar turns dark blue, and the dark blue banner at the bottom of the viewer displays additional details about that result.

In the example above, the banner shows the overall score (227), the score’s percentile rank (66th) among the scores in the current display, the name of the test device, and basic hardware disclosure information. If the source of the result is PT, users can click the Run info button to see the run’s individual workload scores. If the source is an external publisher, users can click the Source link to navigate to the original site.

The viewer includes a drop-down menu that lets users quickly filter results by major device type categories, and a tab that with additional filtering options, such as browser type, processor vendor, and result source. The screenshot below shows the viewer after I used the device type drop-down filter to select only desktops.

The screenshot below shows the viewer as I use the filter tab to explore additional filter options, such processor vendor.

The viewer also lets users pin multiple specific runs, which is helpful for making side-by-side comparisons. The screenshot below shows the viewer after I pinned four runs and viewed them on the Pinned runs screen.

The screenshot below shows the viewer after I clicked the Compare runs button. The overall and individual workload scores of the pinned runs appear in a table.

We’re excited about the WebXPRT 4 results viewer, and we want to hear your feedback. Are there features you’d really like to see, or ways we can improve the viewer? Please let us know, and send us your latest test results!

Justin

How we evaluate new WebXPRT workload proposals

A key value of the BenchmarkXPRT Development Community is our openness to user feedback. Whether it’s positive feedback about our benchmarks, constructive criticism, ideas for completely new benchmarks, or proposed workload scenarios for existing benchmarks, we appreciate your input and give it serious consideration.

We’re currently accepting ideas and suggestions for ways we can improve WebXPRT 4. We are open to adding both non-workload features and new auxiliary tests, which can be experimental or targeted workloads that run separately from the main test and produce their own scores. You can read more about experimental WebXPRT 4 workloads here. However, a recent user question about possible WebGPU workloads has prompted us to explain the types of parameters that we consider when we evaluate a new WebXPRT workload proposal.

Community interest and real-life relevance

The first two parameters we use when evaluating a WebXPRT workload proposal are straightforward: are people interested in the workload and is it relevant to real life? We originally developed WebXPRT to evaluate device performance using the types of web-based tasks that people are likely to encounter daily, and real-life relevancy continues to be an important criterion for us during development. There are many technologies, functions, and use cases that we could test in a web environment, but only some of them are both relevant to common applications or usage patterns and likely to be interesting to lab testers and tech reviewers.

Maximum cross-platform support

Currently, WebXPRT runs in almost any web browser, on almost any device that has a web browser, and we would ideally maintain that broad level of cross-platform support when introducing new workloads. However, technical differences in the ways that different browsers execute tasks mean that some types of scenarios would be impossible to include without breaking our cross-platform commitment.

One reason that we’re considering auxiliary workloads with WebXPRT, e.g., a battery life rundown, is that those workloads would allow WebXPRT to offer additional value to users while maintaining the cross-platform nature of the main test. Even if a battery life test ran on only one major browser, it could still be very useful to many people.

Performance differentiation

Computer benchmarks such as the XPRTs exist to provide users with reliable metrics that they can use to gauge how well target platforms or technologies perform certain tasks. With a broadly targeted benchmark such as WebXPRT, if the workloads are so heavy that most devices can’t handle them, or so light that most devices complete them without being taxed, the results will have little to no use for OEM labs, the tech press, or independent users when evaluating devices or making purchasing decisions.

Consequently, with any new WebXPRT workload, we try to find a sweet spot in terms of how demanding it is. We want it to run on a wide range of devices—from low-end devices that are several years old to brand-new high-end devices and everything in between. We also want users to see a wide range of workload scores and resulting overall scores, so they can easily grasp the different performance capabilities of the devices under test.

Consistency and replicability

Finally, workloads should produce scores that consistently fall within an acceptable margin of error, and are easily to replicate with additional testing or comparable gear. Some web technologies are very sensitive to uncontrollable or unpredictable variables, such as internet speed. A workload that measures one of those technologies would be unlikely to produce results that are consistent and easily replicated.

We hope this post will be useful for folks who are contemplating potential new WebXPRT workloads. If you have any general thoughts about browser performance testing, or specific workload ideas that you’d like us to consider, please let us know.

Justin

WebXPRT’s mirror host site in Singapore

If you’ve ever spent time exploring WebXPRT.com, you may have noticed a line that says, “If you are in East Asia, you can run WebXPRT from our Singapore host,” followed by a hyperlink with Simplified Chinese characters. We realize that some people may not know why we have a WebXPRT mirror host site in Singapore—or how to use it—so today’s post will cover the basics.

When we first released WebXPRT 2013, some users in mainland China reported slow download times when running the benchmark. These slowdowns affected initial page and workload content load times, but not workload execution, which happens locally. As a result, subtest and overall scores were still consistent with expectations for the devices under test, but it took longer than normal for test runs to complete. In response, we set up a mirror host site in Singapore to facilitate WebXPRT testing in China and other East Asian countries. We continued this practice with subsequent WebXPRT versions, and currently offer Singapore-based instances of WebXPRT 4WebXPRT 3, and WebXPRT 2015.

The link to WebXPRT 4 Singapore on WebXPRT.com

The default UI language on the Singapore site is Simplified Chinese, but users can opt to change the language to English or German. Apart from a different default language, the WebXPRT mirror instances hosted in Singapore are identical to the instances on the main WebXPRT site. If you test a device on WebXPRT Singapore and WebXPRT.com, you should see similar performance scores from both sites.

The start page for WebXPRT 4 Singapore, with the default Simplified Chinese UI

We hope that the WebXPRT mirror host site in Singapore will make it easier for people in East Asia to use the benchmark. Do you find the site useful? If so, we’d love to hear from you! Also, if you encounter any unexpected issues or interruptions while testing, please let us know!

Justin

Best practices in benchmarking

From time to time, a tester writes to ask for help determining why they see different WebXPRT scores on two systems that have the same hardware configuration. The scores sometimes differ by a significant percentage. This can happen for many reasons, including different software stacks, but score variability can also result from different testing behavior and environments. While a small amount of variability is normal, these types of questions provide an opportunity to talk about the basic benchmarking practices we follow in the XPRT lab to produce the most consistent and reliable scores.

Below, we list a few basic best practices you might find useful in your testing. Most of them relate to evaluating browser performance with WebXPRT, but several of these practices apply to other benchmarks as well.

  • Test with clean images: We typically use an out-of-box (OOB) method for testing new devices in the XPRT lab. OOB testing means that other than running the initial OS and browser version updates that users are likely to run after first turning on the device, we change as little as possible before testing. We want to assess the performance that buyers are likely to see when they first purchase the device, before installing additional apps and utilities. This is the best way to provide an accurate assessment of the performance retail buyers will experience. While OOB is not appropriate for certain types of testing, the key is to not test a device that’s bogged down with programs that will influence results.
  • Turn off automatic updates: We do our best to eliminate or minimize app and system updates after initial setup. Some vendors are making it more difficult to turn off updates completely, but you should always double-check update settings before testing.
  • Get a baseline for system processes: Depending on the system and the OS, a significant amount of system-level activity can be going on in the background after you turn it on. As much as possible, we like to wait for a stable (idle) baseline of system activity before kicking off a test. If we start testing immediately after booting the system, we often see higher variance in the first run before the scores start to tighten up.
  • Hardware is not the only important factor: Most people know that different browsers produce different performance scores on the same system. However, testers aren’t always aware of shifts in performance between different versions of the same browser. While most updates don’t have a large impact on performance, a few updates have increased (or even decreased) browser performance by a significant amount. For this reason, it’s always worthwhile to record and disclose the extended browser version number for each test run. The same principle applies to any other relevant software.
  • Use more than one data point: Because of natural variance, our standard practice in the XPRT lab is to publish a score that represents the median from three to five runs, if not more. If you run a benchmark only once, and the score differs significantly from other published scores, your result could be an outlier that you would not see again under stable testing conditions.

We hope these tips will help make your testing more accurate. If you have any questions about the XPRTs, or about benchmarking in general, feel free to ask!

Justin

WebXPRT’s global reach

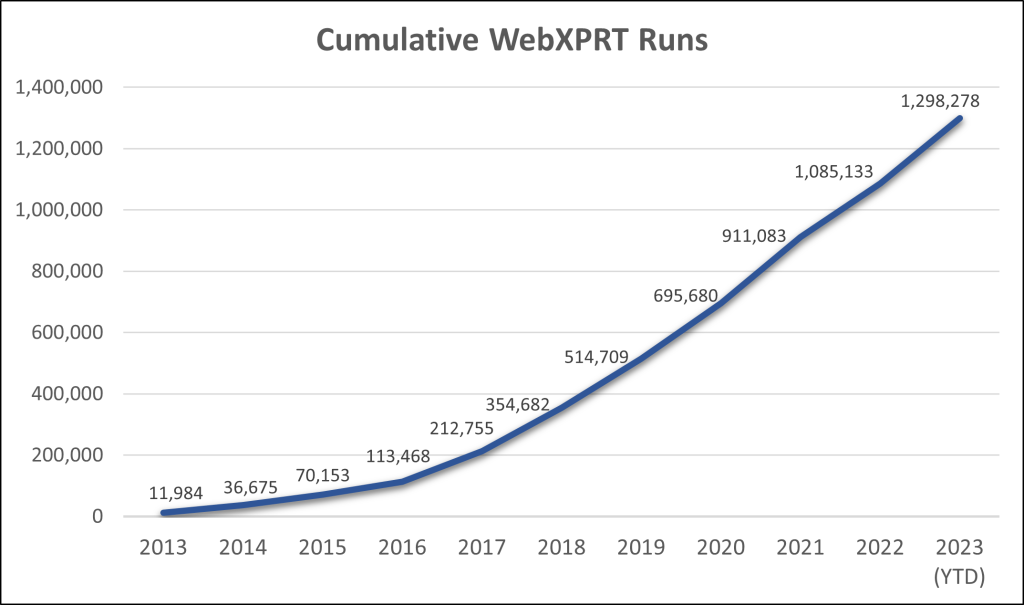
In our last blog post, we reflected on the 10-year anniversary of the WebXPRT launch by looking at the consistent growth in the number of WebXPRT runs over the last decade. Today, we wrap up our focus on WebXPRT’s anniversary by sharing some data about the benchmark’s truly global reach.

We occasionally update the community on some of the reach metrics we track by publishing a new version of the “XPRTs around the world” infographic. The metrics include completed test runs, benchmark downloads, and mentions of the XPRTs in advertisements, articles, and tech reviews. This information gives us insight into how many people are using the XPRT tools, and publishing the infographic helps readers and community members see the impact the XPRTs are having around the world.

WebXPRT is our most widely used benchmark by far, and is responsible for much of the XPRT’s global reach. Since February 2013, users have run WebXPRT more than 1,176,000 times. Those test runs took place in over 924 cities located in 81 countries on six continents. Some interesting new locations for completed WebXPRT runs include Rajarampur, Bangladesh; Al Muharraq, Bahrain; Manila, The Philippines; Skopje, Macedonia; and Ljubljana, Slovenia.

We’re pleased that WebXPRT has proven to be a useful and reliable performance evaluation tool for so many people in so many geographically distant locations. If you’ve ever run WebXPRT in a country that is not highlighted in the “XPRTs around the world” infographic, we’d love to hear about it!

Justin

Check out the other XPRTs:

Forgot your password?