
If you’ve been reading the XPRT blog for a while, you know that we occasionally like to revisit a series of in-house WebXPRT comparison tests to see if recent updates have changed the performance rankings of popular web browsers. We published our most recent comparison last April, when we used WebXPRT 4 to compare the performance of five browsers on the same system.
For this round of tests, we used a Dell XPS 13 7930, which features an Intel Core i3-10110U processor and 4 GB of RAM, running Windows 11 Home updated to version 22H2 (22621.1105). We installed all current Windows updates, and updated each of the browsers under test: Brave, Google Chrome, Microsoft Edge, Mozilla Firefox, and Opera.
After the update process completed, we turned off updates to prevent them from interfering with test runs. We ran WebXPRT 4 three times on each of the five browsers. The score we post for each browser is the median of the three test runs.
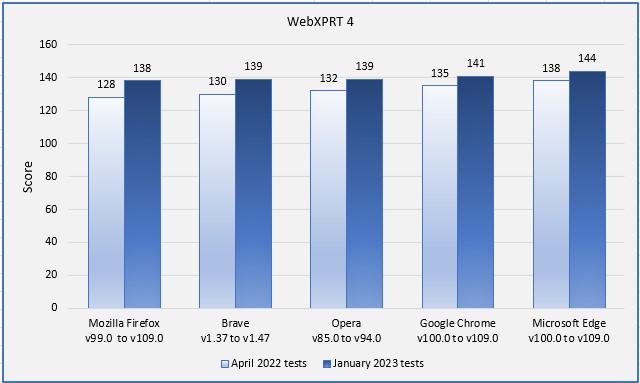
In our last round of tests, Edge was the clear winner, with a 2.2 percent performance advantage over Chrome. Firefox came in last, about 3 percent slower than Opera, which was in the middle of the pack. With updated versions of the browsers, the only change in rank order was that Brave moved into a tie with Opera.
While the rank order from this round of tests was very similar to the previous round, we did observe two clear performance trends: (1) the range between high and low scores was tighter, dropping from a difference of 7.8 percent to 4.3 percent, and (2) every browser demonstrated improved performance. The chart below illustrates both trends. Firefox showed the single largest score improvement at 7.8 percent, but the performance jump for each browser was considerable.
Do these results mean that Microsoft Edge will always provide a speedier web experience, or Firefox will always be slower than the others? Not necessarily. It’s true that a device with a higher WebXPRT score will probably feel faster during daily web activities than one with a much lower score, but your experience depends in part on the types of things you do on the web, along with your system’s privacy settings, memory load, ecosystem integration, extension activity, and web app capabilities.
In addition, browser speed can noticeably increase or decrease after an update, and OS-specific optimizations can affect performance, such as with Edge on Windows 11 and Chrome on Chrome OS. All these variables are important to keep in mind when considering how WebXPRT results translate to your everyday experience.
Have you used WebXPRT to compare browser performance on the same system? Let us know how it turned out!
Justin