BenchmarkXPRT Blog banner

Category: Benchmark metrics

Keep them coming!

Questions and comments have continued to come in since the Webinar last week. Here are a few of them:

  • How long are results valid? For a reviewer like us, we need to know that we can reuse results for a reasonable length of time. There is a tension between keeping results stable and keeping the benchmark current enough for the results to be relevant. Historically, HDXPRT allowed at least a year between releases. Based on the feedback we’ve received, a year seems like a reasonable length of time.
  • Is HDXPRT command line operable? (asked by a community member with a scripted suite of tests) HDXPRT 2012 is not, but we will consider adding a command line interface for HDXPRT 2013. While most casual users don’t need a command line interface, it could be very valuable to those of us using HDXPRT in labs.
  • I would be hesitant to overemphasize the running time of HDXPRT. The more applications it runs, the more it can differentiate things and the more interesting it is to those of us who run it at a professional level. If I could say “This gives a complete overview of the performance of this system,” that would actually save time. This comment was a surprise, given the amount of feedback we received saying that HDXPRT was too large. However, this gets to the heart of why we all need to be careful as we consider which applications to include in HDXPRT 2013.

If you had to miss the Webinar, it’s available at the BenchmarkXPRT 2013 Webinars page.

We’re planning to release the HDXPRT 2013 RFC next week. We’re looking forward to your comments.

Eric

Comment on this post in the forums

TouchXPRT in the fast lane

I titled last week’s blog “Putting the TouchXPRT pedal to the metal.” The metaphor still applies. On Monday, we released TouchXPRT 2013 Community Preview 1 (CP1).  Members can download it here.

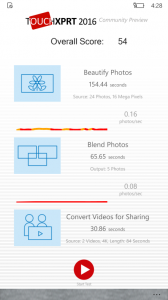
CP1 contains five scenarios based on our research and community feedback. The scenarios are Beautify Photo Album, Prepare Photos for Sharing, Convert Videos for Sharing, Export Podcast to MP3, and Create Slideshow from Photos.

Each scenario gives two types of results. There’s a rate, which allows for simple “bigger is better” comparisons. CP1 also gives the elapsed time for each scenario, which is easier to grasp intuitively. Each approach has its advantages. We’d like to get your feedback on whether you’d like us to pick one of those metrics for the final version of TouchXPRT 2013 or whether it makes more sense to include both. You’ll find a fuller description of the scenarios and the results in the TouchXPRT 2013 Community Preview 1 Design overview.

While you’re looking at CP1, we’re getting the source ready to release.  To check out the source, you’ll need a system running Windows 8, with Visual Studio 2012 installed. We hope to release it on Friday. Keep your eye the TouchXPRT forums for more details.

Post your feedback to the TouchXPRT forum, or e-mail it to TouchXPRTSupport@principledtechnologies.com.  Do you want more scenarios? Different metrics? A new UI feature? Let us know! Make TouchXPRT the benchmark you want it to be.

As I explained last week, we released CP1 without any restrictions on publishing results. It seems that AnandTech was the first to take advantage of that. Read AnandTech’s Microsoft Surface Review to see TouchXPRT in action.

We are hoping that other folks take advantage of CP1’s capability to act as a cross-platform benchmark on the new class of Windows 8 devices. Come join us in the fast lane!

Bill

Comment on this post in the forums

Keeping score

One question I received as a result of the last two blog entries on benchmark anatomy was whether I was going to talk about the results or scores.  That topic seemed like a natural follow up.

All benchmarks need to provide some sort of metric to let you know how well the system under test (SUT) did.  I think the best metrics are the easily understood ones.  These metrics have units like time or watts.  The problem with some of these units is that sometimes smaller can be better.  For example, less time to complete a task is better.  (Of course, more time before the battery runs down is better!)  People generally see bigger bars in a chart as better.

Some tests, however, give units that are not so understandable.  Units like instructions per second, requests per second, or frames per second are tougher to relate to.  Sure, more bytes per second would be better, but it is not as easy to understand what that means in the real world.

There is a solution to both the problem of smaller is better and non-intuitive units—normalization.  With normalization, you take the result of the SUT and divide it by that of a defined base or calibration system.  The result is a unit-less number.  So, if the base system can do 100 blips a second and the SUT can do 143 blips a second, the SUT would get 143 / 100 or a score of 1.43.  The units cancel out in the math and what is left is a score.  For appearance or convenience, the score may be multiplied by some number like 10 or 100 to make the SUT’s score 14.3 or 143.

The nice thing about such scores is that it is easy to see how much faster one system is than another.  If you are measuring normalized execution time, a score of 286 means a system is twice as fast as one of 143.  As a bonus, bigger numbers are better.  An added benefit is that it is much easier to combine multiple normalized results into a single score.  These benefits are the reason that many modern benchmarks use normalized scores.

There is another kind of score, which is more of a rating.  These scores, such as a number of stars or thumbs up, are good for relative ratings.  However, they are not necessarily linear.  Four thumbs up is better than two, but is not necessarily twice as good.

Next week, we’ll look closer at the results HDXPRT 2011 provides and maybe even venture into the difference between arithmetic, geometric, and harmonic means!  (I know I can’t wait.)

Bill

Comment on this post in the forums

Benchmarking a benchmark

One of the challenges of any benchmark is understanding its characteristics. The goal of a benchmark is to measure performance under a defined set of circumstances. For system-level, application-oriented benchmarks, it isn’t always obvious how individual components in the system influence the overall score. For instance, how does doubling the amount of memory affect the benchmark score? The best way to understand the characteristics of a benchmark is to run a series of carefully controlled experiments that change one variable at a time. To test the benchmark’s behavior with increased memory, you would take a system and run the benchmark with different amounts of RAM. Changing the processor, graphics subsystem, or hard disk lets you see the influence of those components. Some components, like memory, can change in both their amount and speed.

The full matrix of system components to test can quickly grow very large. While the goal is to change only one component at a time, this is not always possible. For example, you can’t change the processor from an Intel to an AMD without also changing the motherboard.

We are in the process of putting HDXPRT 2011 through a series of such tests. HDXPRT 2011 is a system-level, application-oriented benchmark for measuring the performance of PCs on consumer-oriented HD media scenarios. We want to understand, and share with you, how different components influence HDXPRT scores. We expect to release a report on our findings next week. It will include results detailing the effect of processor speed, amount of RAM, hard disk type, and graphics subsystem.

There is a tradeoff between the size of the matrix and how long it takes to produce the results. We’ve tried to choose the areas we felt were most important, but we’d like to hear what you consider important. So, what characteristics of HDXPRT 2011 would you like to see us test?

Bill

Comment on this post in the forums

Petaflops?

I saw an article earlier this week about Japan’s K Computer, the latest computer to be designated the “fastest supercomputer” in the world.  Twice a year (June and November), the Top500 list comes out.  The list’s publishers consider the highest scoring computer on the list as the fastest computer in the world.  The first article I read about the recent rankings did not cite the results, just the rankings.  So, I went to another article which referred to the K computer as capable of 8.2 quadrillion calculations per second, but did not give the results of the other leading supercomputers.  On to the next article which said the K Computer was capable of 1.2 petaflops per second.  (The phrase petaflops per second is in the same category as ATM machine or PIN number…)  The same article said that the third fastest was able to get 1.75 petaflops per second.  OK, now I was definitely confused.  (I really miss the old days of good copy editing and fact checking, but that is a blog for another day.)

So, I went to the source, the Top500 Web site (www.top500.org).  It confirmed that the K Computer obtained 8.16 petaflops (or quadrillion calculations per second) on the LINPACK test.  The Chinese Tianhe-1A got 2.56 petaflops and the American Jaguar, 1.76 petaflops.

Once I got over the sloppy reporting and stopped playing with the graphs of the trends and scores over time, I started thinking about the problem of metrics and the importance of making them easy to understand.  Some metrics are very easy to report and understand.  For example, a battery life benchmark reports its results in hours and minutes.  We all know what this means and we know that more hours and minutes is a good thing.  Understanding what petaflops are is decidedly harder.

Another issue is the desire for bigger numbers to mean better results.  The time to finish a task is fairly easy to understand, but in that case, less time is better.  One technique for dealing with this issue is to normalize the numbers.  Basically, that means to divide the result (such as a time) by the result of a baseline system’s result.  The baseline system’s result is typically considered to be 1.0 (or some other number like 10 or 100) and other results are meaningful only in relation to the baseline system or each other.  A system scoring 2.0 runs twice as fast as the baseline system’s 1.0.  While that is clear, it does take more explanation than just seconds.

Finding the right metrics was a challenge we faced with HDXPRT 2011. Do you think we got it right? Please let us know what you think.

Bill

Comment on this post in the forums

Check out the other XPRTs:

Forgot your password?