In the last few weeks, we reintroduced readers to the capabilities and benefits of TouchXPRT and CrXPRT. This week, we’d like to reintroduce BatteryXPRT 2014 for Android, an app that evaluates the battery life and performance of Android devices.
When purchasing a phone or tablet, it’s good to know how long the battery will last on a typical day and how often you’ll need to charge it. Before BatteryXPRT, you had to rely on a manufacturer’s estimate or full rundown tests that perform tasks that don’t resemble the types of things we do with our phones and tablets every day.
We developed BatteryXPRT to estimate battery life reliably in just over five hours, so testers can complete a full evaluation in one work day or while sleeping. You can configure it to run while the device is connected to a network or in Airplane mode. The test also produces a performance score by running workloads that represent common everyday tasks.
BatteryXPRT is easy to install and run, and is a great resource for anyone who wants to evaluate how well an Android device will meet their needs. If you’d like to see test results from a variety of Android devices, go to BatteryXPRT.com and click View Results, where you’ll find scores from many different Android devices.
If you’d like to run BatteryXPRT:
Simply download BatteryXPRT from the Google Play store or BatteryXPRT.com. The BatteryXPRT installation instructions and user manual provide step-by-step instructions for how to configure your device and kick off a test. We designed BatteryXPRT 2014 for Android to be compatible with a wide variety of Android devices, but because there are so many devices on the market, it is inevitable that users occasionally run into problems. In the Tips, tricks, and known issues document, we provide troubleshooting suggestions for issues we encountered during development testing.
If you’d like to learn more:
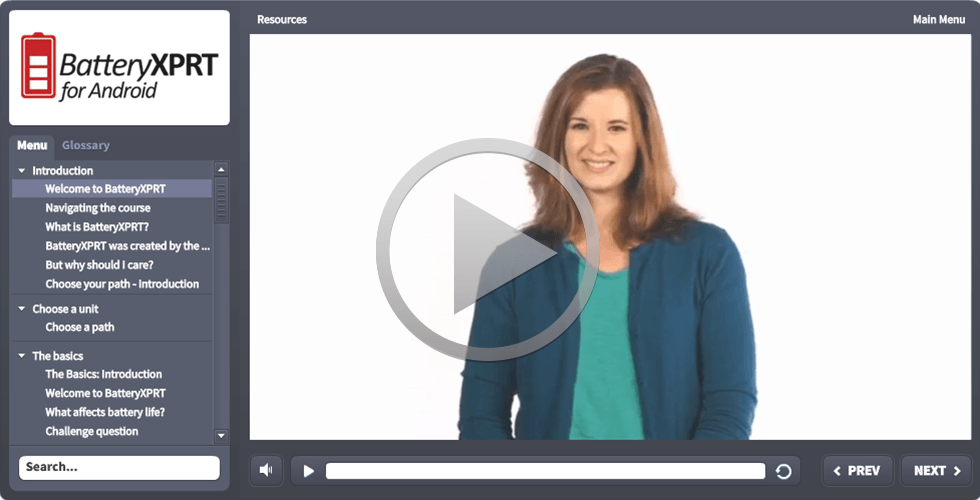
We offer a full online BatteryXPRT training course that covers almost every aspect of the benchmark. You can view the sections in order or jump to the parts that interest you. We guarantee that you’ll learn something new!
If you’d like to dig into the details:
Check out the Exploring BatteryXPRT 2014 for Android white paper. In it, we discuss the app’s development and structure. We also describe the component tests; explain the differences between the test’s Airplane, Wi-Fi, and Cellular modes; and detail the statistical processes we use to calculate expected battery life.
If you’d like to dig even deeper, the BatteryXPRT source code is available to members of the BenchmarkXPRT Development Community, so consider joining today. Membership is free for members of any company or organization with an interest in benchmarks, and there are no obligations after joining.
If you haven’t used BatteryXPRT before, try it out and let us know what you think!
Justin