BenchmarkXPRT Blog banner

Search Results for: results viewer

The WebXPRT 4 results viewer: A powerful tool for browsing hundreds of test results

In our recent blog post about the XPRT results database, we promised to discuss the WebXPRT 4 results viewer in more detail. We developed the results viewer to serve as a feature-rich interactive tool that visitors to WebXPRT.com can use to browse the test results that we’ve published on our site, dig into the details of each result, and compare scores from multiple devices. The viewer currently has almost 700 test results, and we add new PT-curated entries each week.

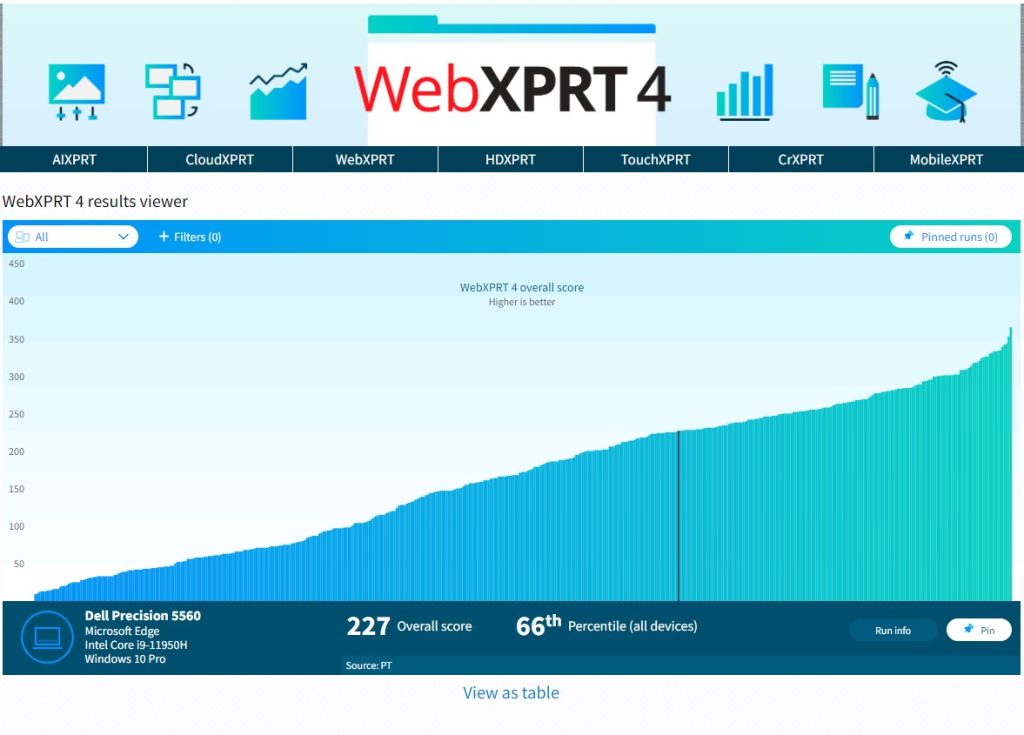
Figure 1 shows the tool’s default display. Each vertical bar in the graph represents the overall score of a single test result, with bars arranged left-to-right, from lowest to highest. To view a single result in detail, hover over a bar to highlight it, and a small popup window will display the basic details of the result. You can then click to select the highlighted bar. The bar will turn dark blue, and the dark blue banner at the bottom of the viewer will display additional details about that result.
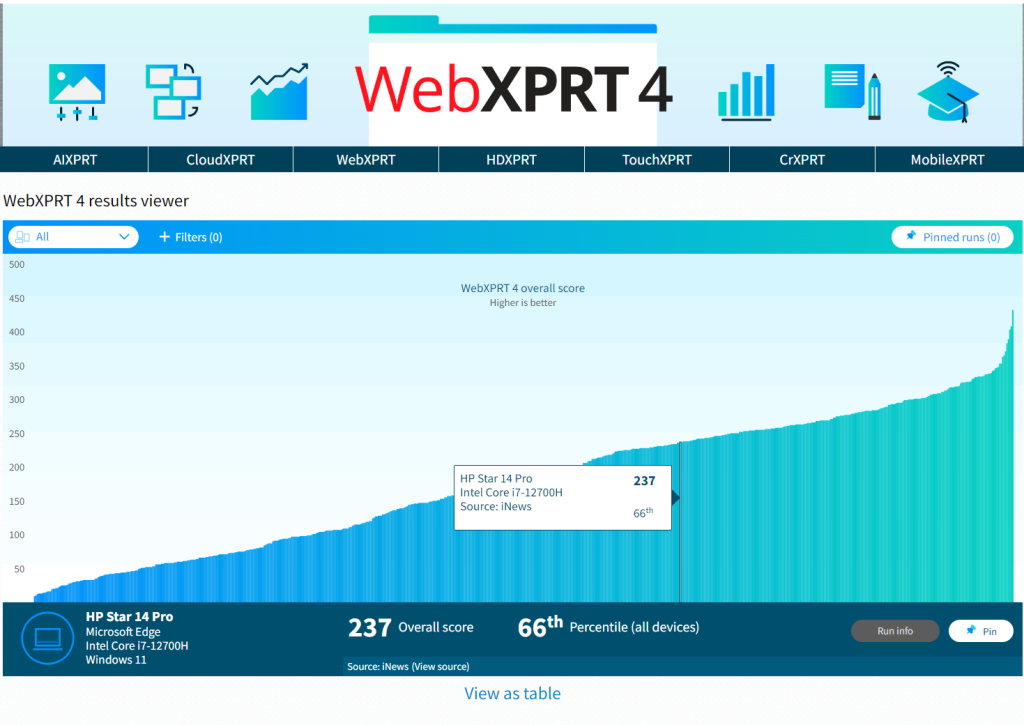
Figure 1: The WebXPRT 4 results viewer tool’s default display

In the example in Figure 1, the banner shows the overall score (237), the score’s percentile rank (66th) among the scores in the current display, the name of the test device, and basic hardware configuration information. If the source of the result is PT, you can click the Run info button in the bottom right-hand corner of the display to see the run’s individual workload scores. If the source is an external publisher, users can click the Source link to navigate to the original site.

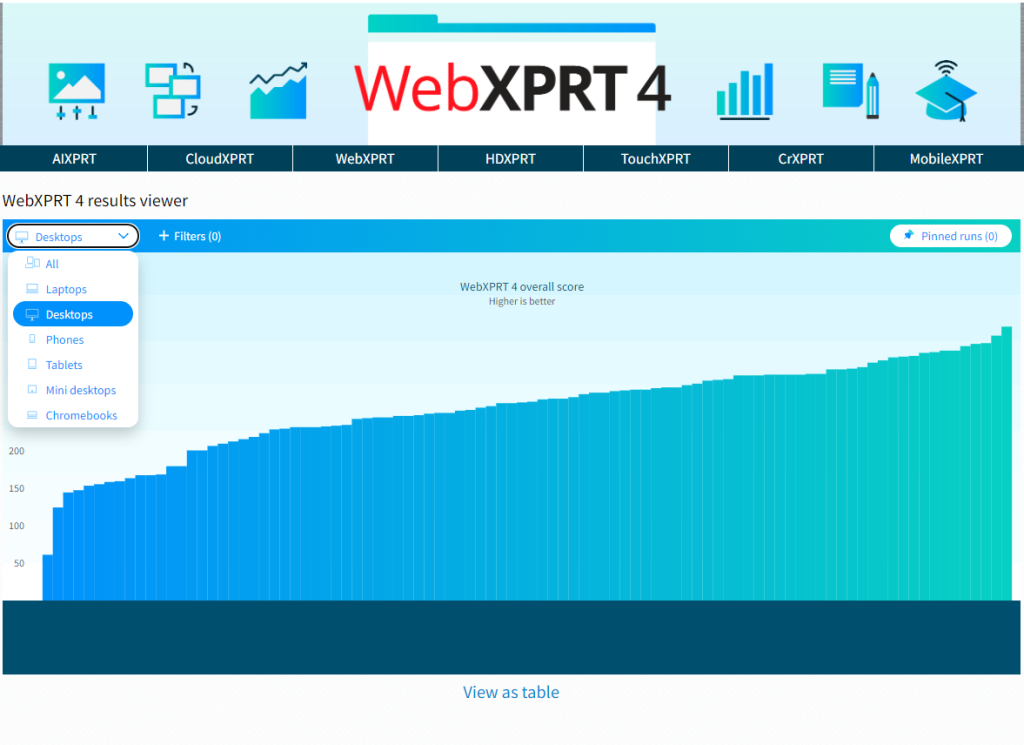
The viewer includes a drop-down menu that lets users quickly filter results by major device type categories, plus a tab with additional filtering options, such as browser type, processor vendor, and result source. Figure 2 shows the viewer after I used the device type drop-down filter to select only laptops.
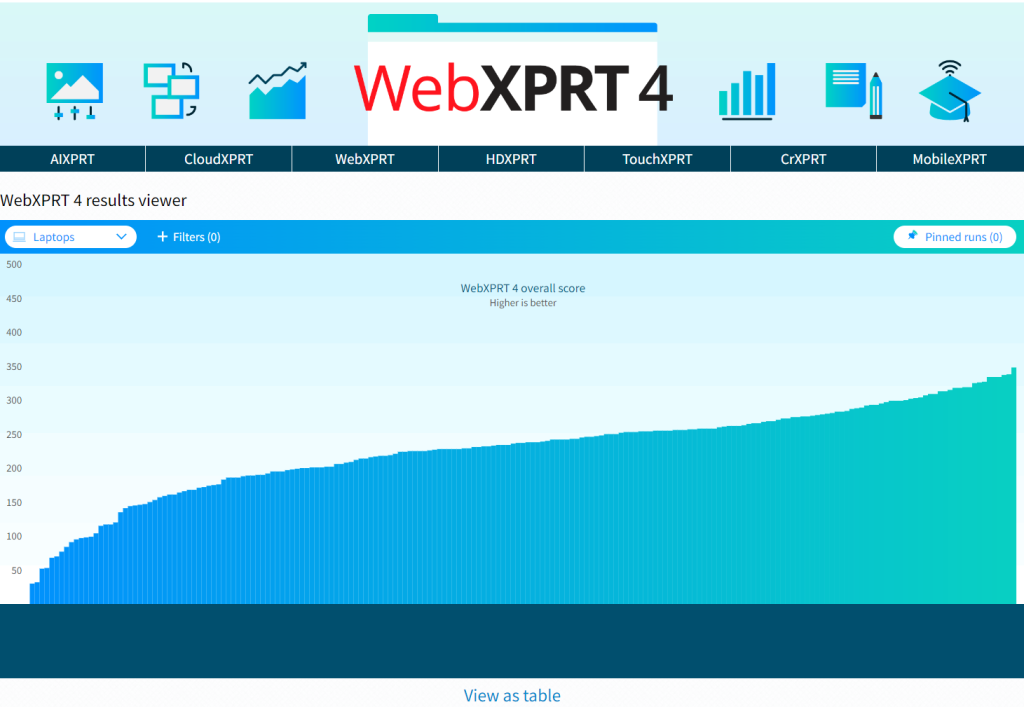
Figure 2: Screenshot from the WebXPRT 4 results viewer showing results filtered by the device type drop-down menu.

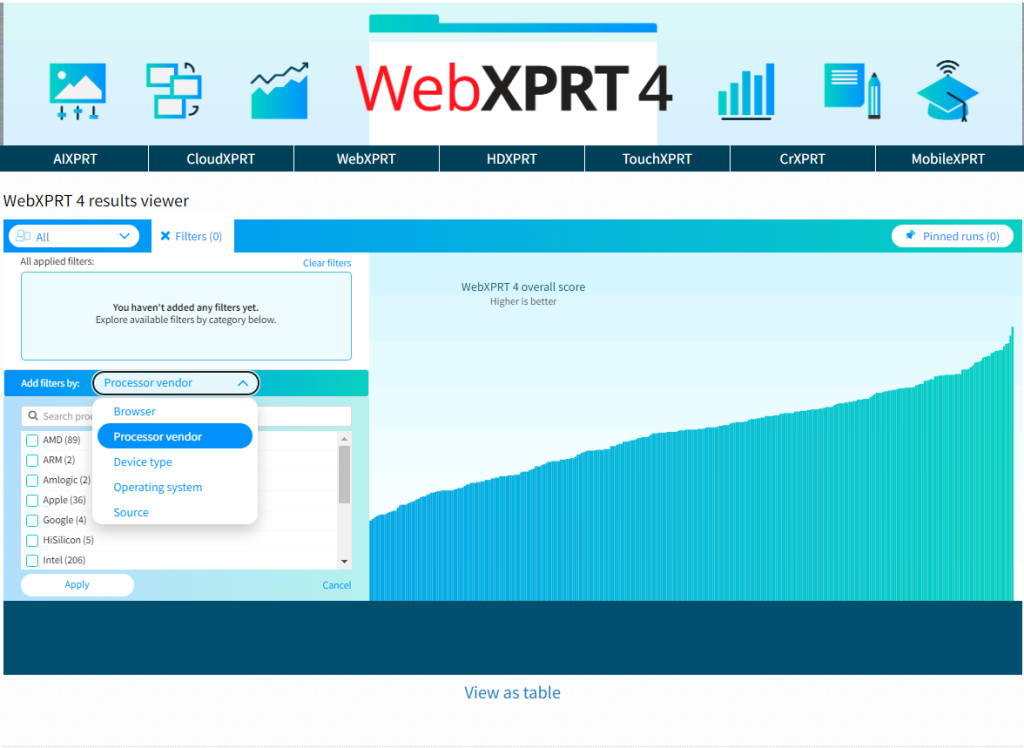
Figure 3 shows the viewer as I use the filter tab to explore additional filter options, such as processor vendor.
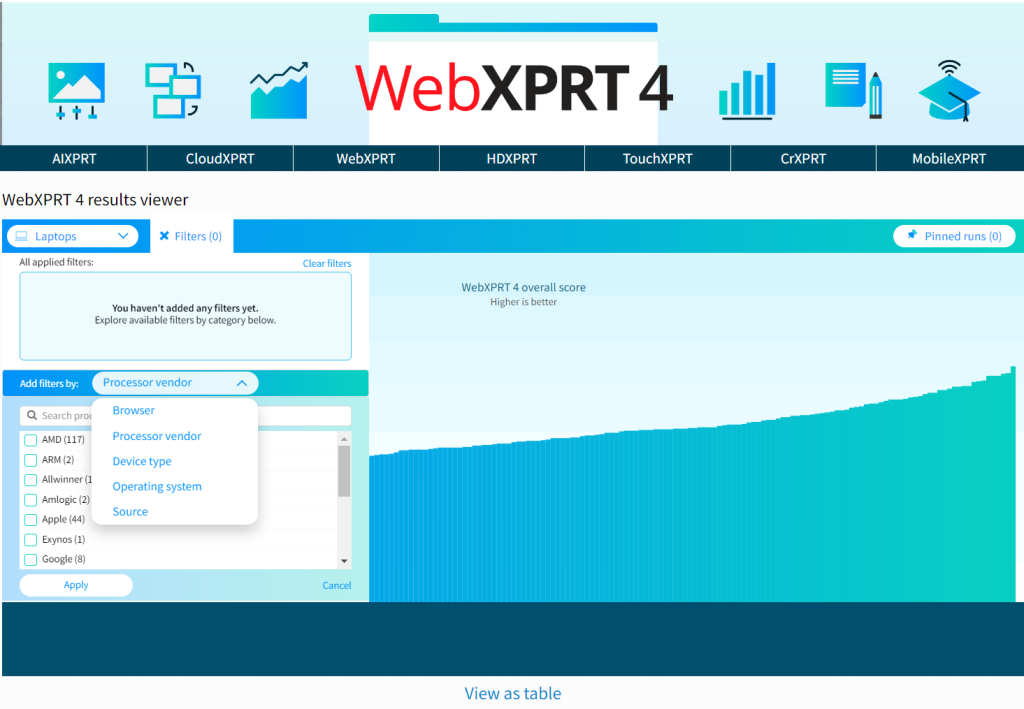
Figure 3: Screenshot from the WebXPRT 4 results viewer showing the filter options available with the filter tab.

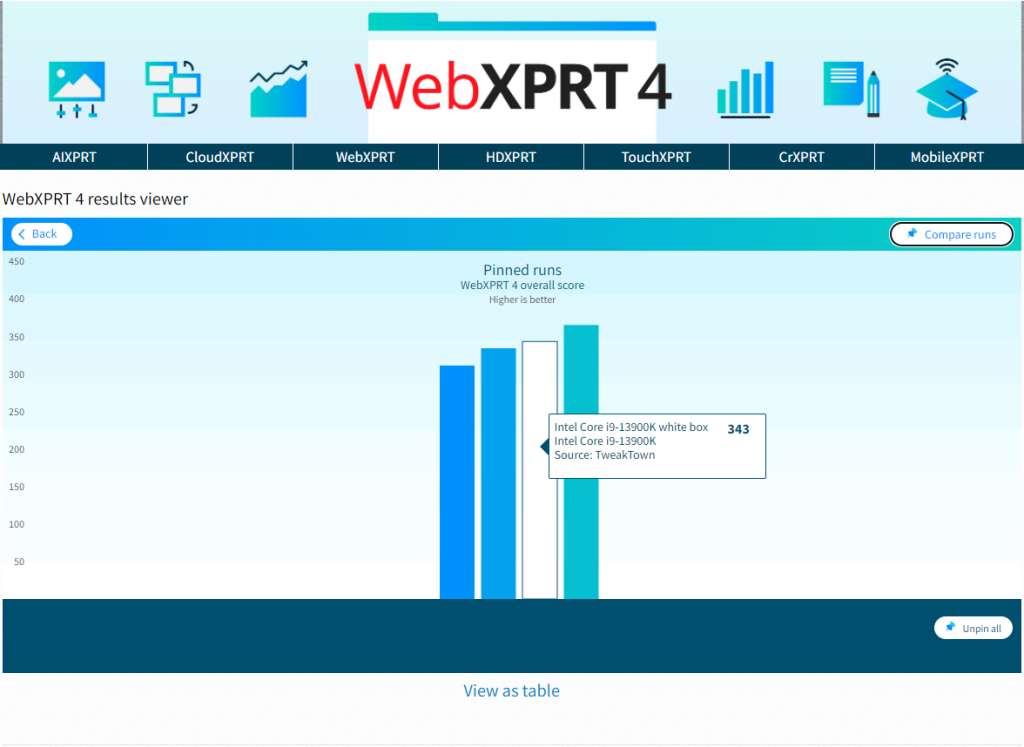
The viewer will also let you pin multiple specific runs, which is helpful for making side-by-side comparisons. Figure 4 shows the viewer after I pinned four runs and viewed them on the Pinned runs screen.
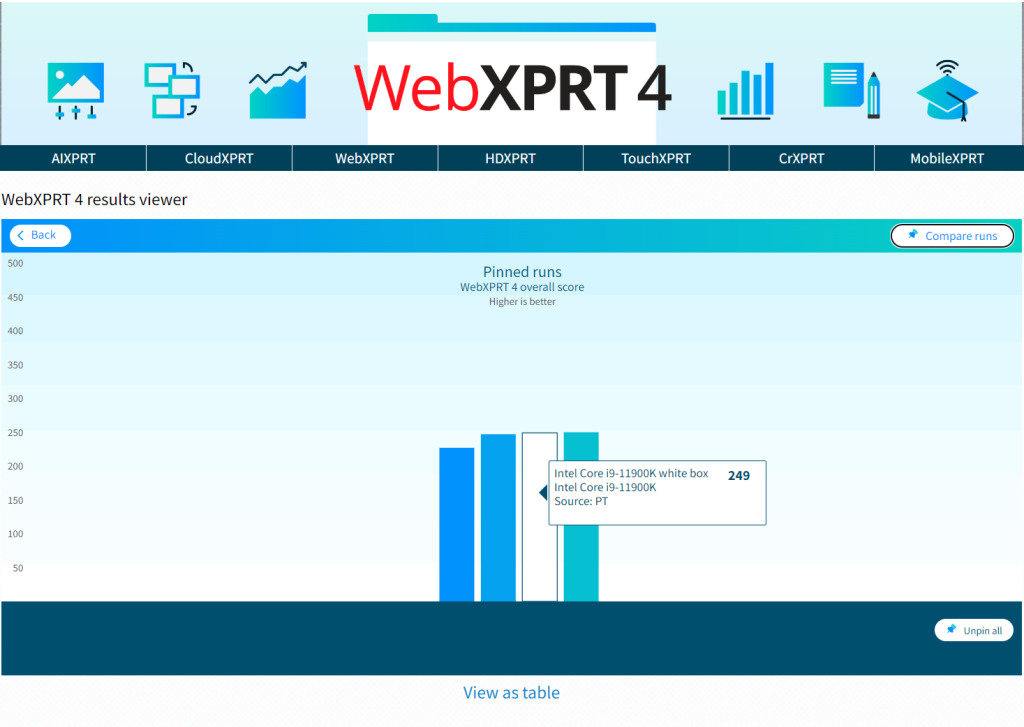
Figure 4: Screenshot from the WebXPRT 4 results viewer showing four pinned runs on the Pinned runs screen.

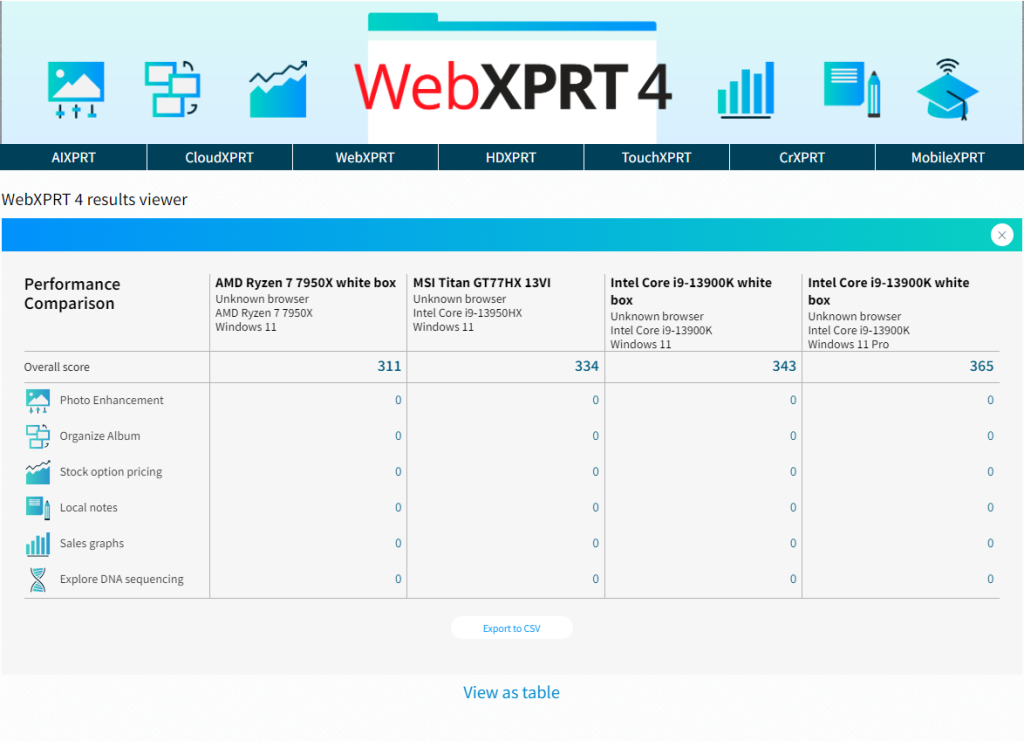
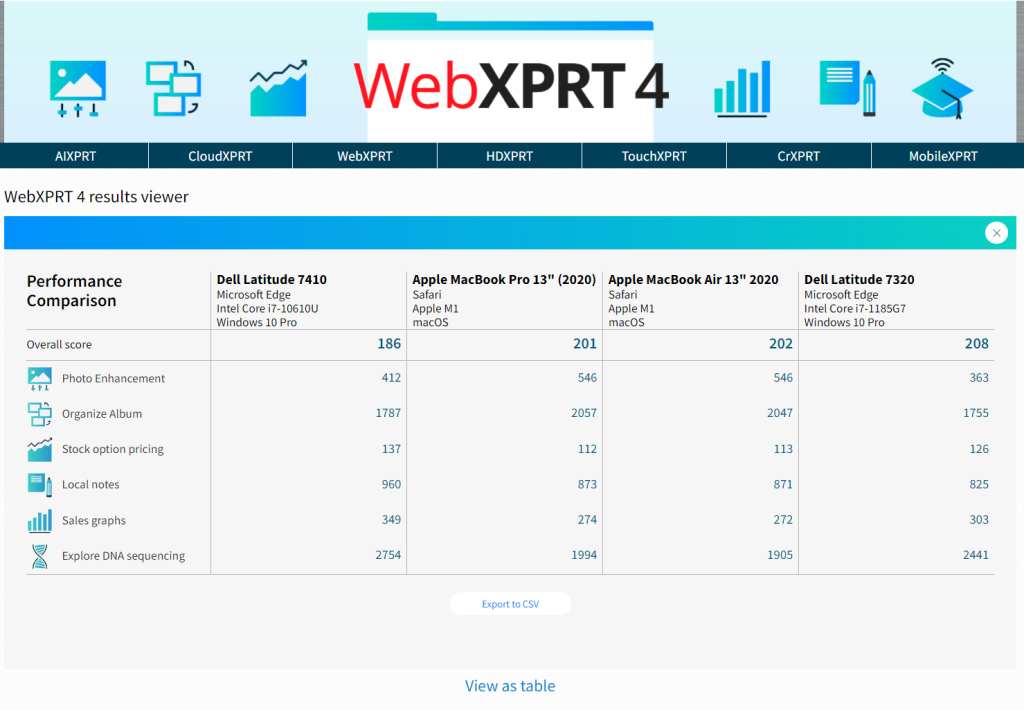
Figure 5 shows the viewer after I clicked the Compare runs button. The overall and individual workload scores of the pinned runs appear in a table.
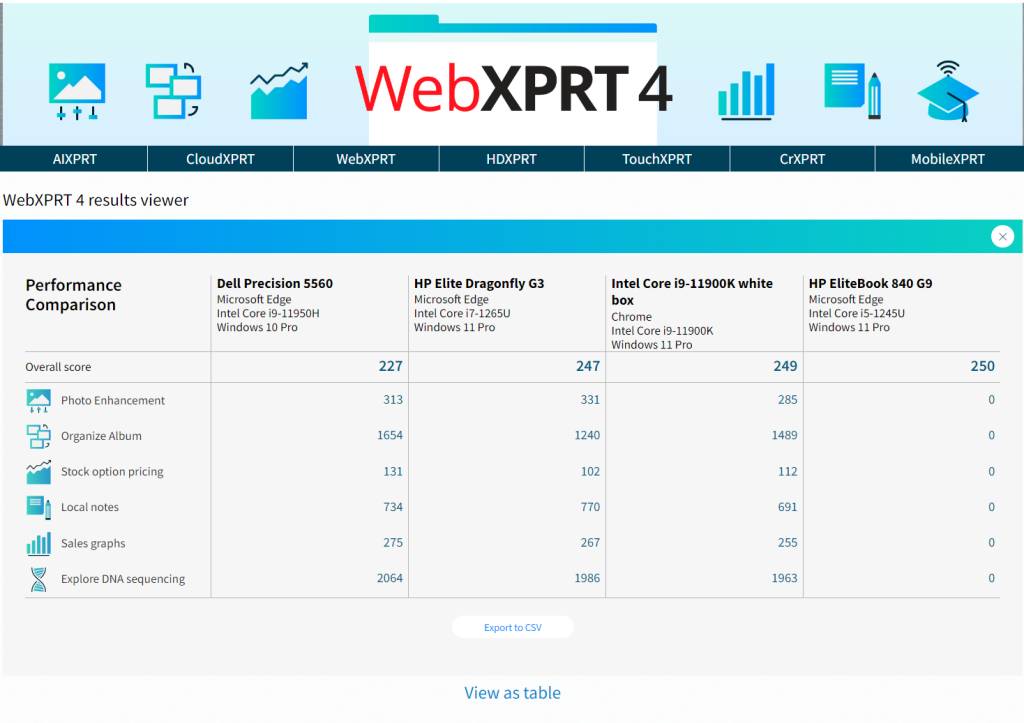
Figure 5: Screenshot from the WebXPRT 4 results viewer showing four pinned runs on the Compare runs screen.

We hope that you’ll enjoy using the results viewer to browse our WebXPRT 4 results database and that it will become one of your go-to resources for device comparison data.  

Are there additional features you’d like to see in the viewer, or other ways we can improve it? Please let us know, and send us your latest test results!

Justin

Check out the WebXPRT 4 results viewer

New visitors to our site may not be aware of the WebXPRT 4 results viewer and how to use it. The viewer provides WebXPRT 4 users with an interactive, information-packed way to browse test results that is not available for earlier versions of the benchmark. With the viewer, users can explore all of the PT-curated results that we’ve published on WebXPRT.com, find more detailed information about those results, and compare results from different devices. The viewer currently displays over 460 results, and we add new entries each week.

The screenshot below shows the tool’s default display. Each vertical bar in the graph represents the overall score of a single test result, with bars arranged from lowest to highest. To view a single result in detail, the user hovers over a bar until it turns white and a small popup window displays the basic details of the result. If the user clicks to select the highlighted bar, the bar turns dark blue, and the dark blue banner at the bottom of the viewer displays additional details about that result.

In the example above, the banner shows the overall score (227), the score’s percentile rank (66th) among the scores in the current display, the name of the test device, and basic hardware disclosure information. If the source of the result is PT, users can click the Run info button to see the run’s individual workload scores. If the source is an external publisher, users can click the Source link to navigate to the original site.

The viewer includes a drop-down menu that lets users quickly filter results by major device type categories, and a tab that with additional filtering options, such as browser type, processor vendor, and result source. The screenshot below shows the viewer after I used the device type drop-down filter to select only desktops.

The screenshot below shows the viewer as I use the filter tab to explore additional filter options, such processor vendor.

The viewer also lets users pin multiple specific runs, which is helpful for making side-by-side comparisons. The screenshot below shows the viewer after I pinned four runs and viewed them on the Pinned runs screen.

The screenshot below shows the viewer after I clicked the Compare runs button. The overall and individual workload scores of the pinned runs appear in a table.

We’re excited about the WebXPRT 4 results viewer, and we want to hear your feedback. Are there features you’d really like to see, or ways we can improve the viewer? Please let us know, and send us your latest test results!

Justin

Exploring the WebXPRT 4 results viewer

Now that WebXPRT 4 is live, we want to remind readers about the features of the WebXPRT 4 results viewer. We’re excited about this new tool, which we view as an ongoing project that we will expand and improve over time. The viewer currently has over 100 test results, and we’re just getting started. We’ll continue to actively populate the viewer with the latest PT-curated WebXPRT 4 results for the foreseeable future.

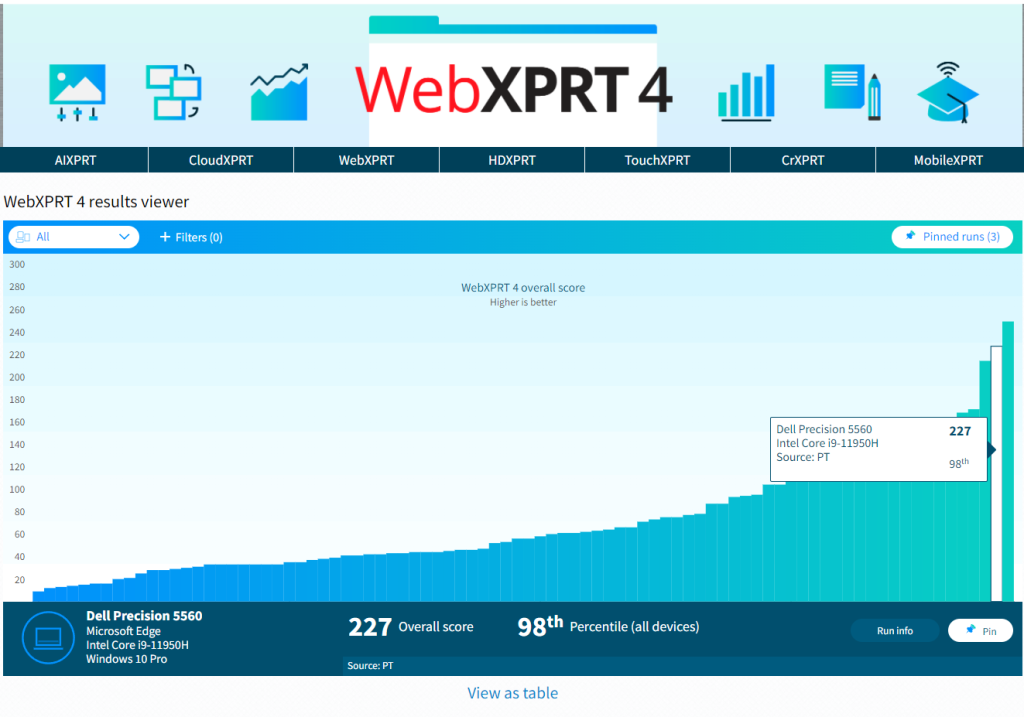
The screenshot below shows the tool’s default display. Each vertical bar in the graph represents the overall score of a single test result, with bars arranged from lowest to highest. To view a single result in detail, the user hovers over a bar until it turns white and a small popup window displays the basic details of the result. Once the user clicks to select the highlighted bar, the bar turns dark blue, and the dark blue banner at the bottom of the viewer displays additional details about that result.

In the example above, the banner shows the overall score (227), the score’s percentile rank (98th) among the scores in the current display, the name of the test device, and basic hardware disclosure information. Users can click the Run info button to see the run’s individual workload scores.

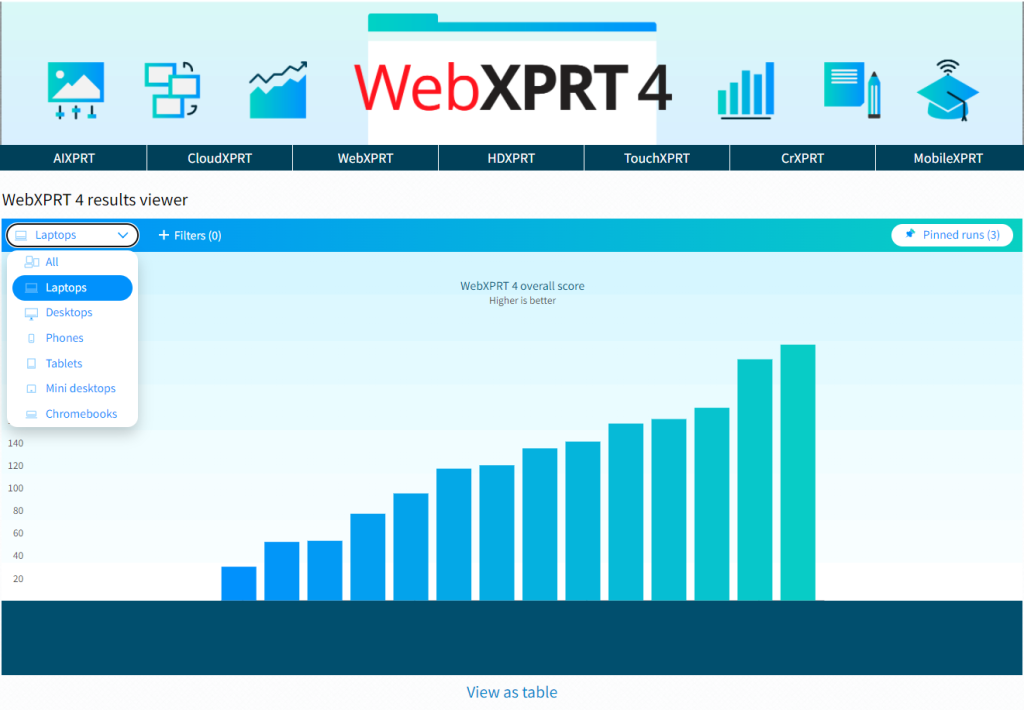
The viewer includes a drop-down menu to quickly filter results by major device type categories, and a tab that allows users to apply additional filtering options, such as browser type, processor vendor, and result source. The screenshot below shows the viewer after I used the device type drop-down filter to select only laptops.

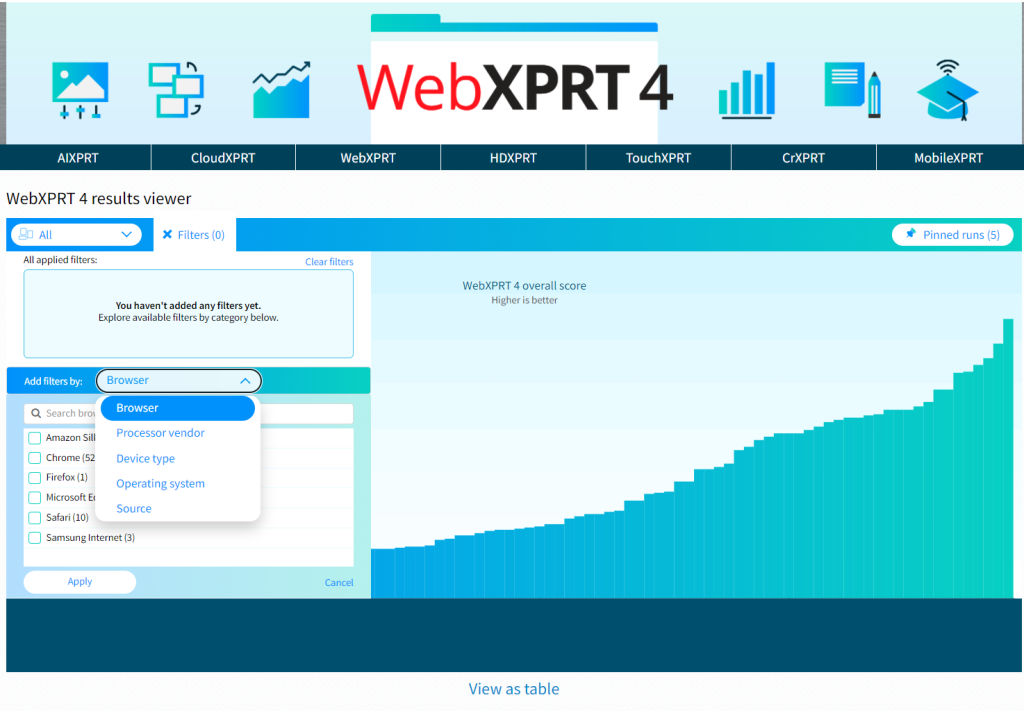
The screenshot below shows the viewer as I use the filter tab to explore additional filter options, such browser type.

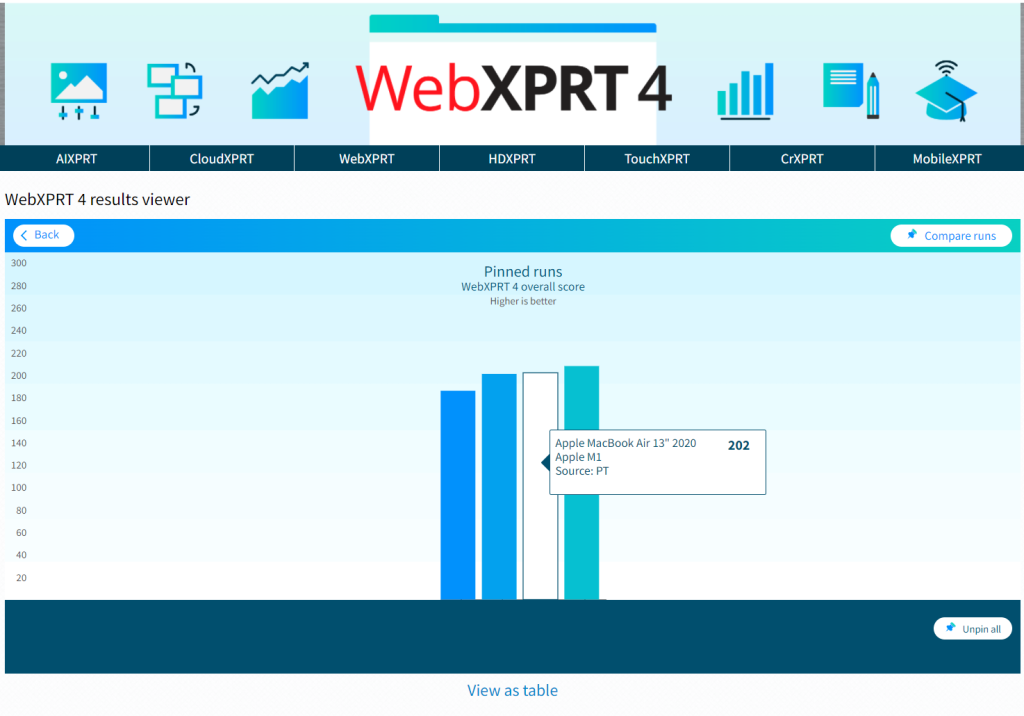
The viewer also lets users pin multiple specific runs, which is helpful for making side-by-side comparisons. The screenshot below shows the viewer after I pinned four runs and viewed them on the Pinned runs screen.

The screenshot below shows the viewer after I clicked the Compare runs button: the overall and individual workload scores of the pinned runs appear as a table.

We’re excited about the WebXPRT 4 results viewer, and we want to hear your feedback. Are there features you’d really like to see, or ways we can improve the viewer? Please let us know, and send us your latest test results!

Justin
The WebXPRT 4 results viewer is live!

In October, we shared an early preview of the new results viewer tool that we’ve been developing in parallel with WebXPRT 4. The WebXPRT 4 Preview is now available to the public, and we’re excited to announce that the new results viewer is also live. We already have over 65 test results in the viewer, and in the weeks leading up to the WebXPRT 4 general release, we’ll be actively populating the viewer with the latest PT-curated WebXPRT 4 Preview results.

We encourage readers to visit the blog for details about the viewer’s features, and to take some time to explore the data. We’re excited about this new tool, which we view as an ongoing project with room for expansion and improvement based on user feedback.

If you have any questions or comments about the WebXPRT 4 Preview or the new results viewer, please feel free to contact us!

Justin

An early preview of the new WebXPRT 4 results viewer!

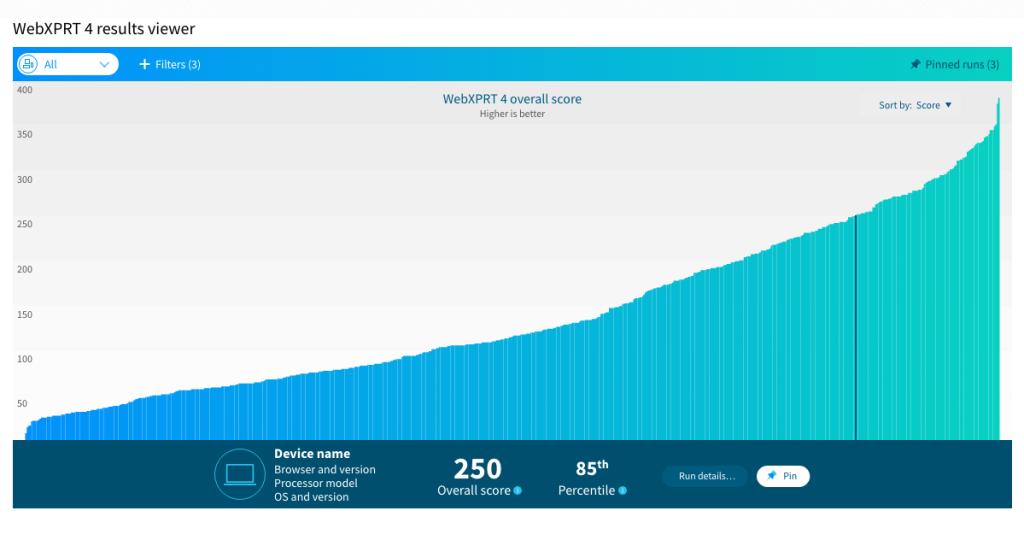
Last week, we shared some new details about the changes we’re likely to make in WebXPRT 4, and a rough target date for publishing a preview build. This week, we’re excited to share an early preview of the new results viewer tool that we plan to release in conjunction with WebXPRT 4. We hope the tool will help testers and analysts access the wealth of WebXPRT test results in our database in an efficient, productive, and enjoyable way. We’re still ironing out many of the details, so some aspects of what we’re showing today might change, but we’d like to give you an idea of what to expect.

The screenshot below shows the tool’s default display. In this example, the viewer displays over 650 sample results—from a wide range of device types—that we’re currently using as placeholder data. The viewer will include several sorting and filtering options, such as device type, hardware specs such as browser type and processor vendor, the source of the result, etc.

Each vertical bar in the graph represents the overall score of single test result, and the graph presents the scores in order from lowest to highest. To view an individual result in detail, the user simply hovers over and selects the bar representing the result. The bar turns dark blue, and the dark blue banner at the bottom of the viewer displays details about that result.

In the example above, the banner shows the overall score (250) and the score’s percentile rank (85th) among the scores in the current display. In the final version of the viewer, the banner will also display the device name of the test system, along with basic hardware disclosure information. Selecting the Run details button will let users see more about the run’s individual workload scores.

We’re still working on a way for users to pin or save specific runs. This would let users easily find the results that interest them, or possibly select multiple runs for a side-by-side comparison.

We’re excited about this new tool, and we look forward to sharing more details here in the blog as we get closer to taking it live. If you have any questions or comments about the results viewer, please feel free to contact us!

Justin

Improving the CloudXPRT results viewer

This week, we made some changes to the CloudXPRT results viewer that we think will simplify the results-browsing experience and allow visitors to more quickly and easily find important data.

The first set of changes involves how we present test system information in the main results table and on the individual results details pages. We realized that there was potential for confusion around the “CPU” and “Number of nodes” categories. We removed those and created the following new fields: “Cluster components,” “Nodes (work + control plane),”  and “vCPUs (work + control plane).” These new categories better describe test configurations and clarify how many CPUs engage with the workload.

The second set of changes involves the number of data points that we list in the table for each web microservices test run. For example, previously, we published a unique entry for each level of concurrency a test run records. If a run scaled to 32 concurrent instances, we presented the data for each instance in its own row. This helped to show the performance curve during a single test as the workload scaled up, but it made it more difficult for visitors to identify the best throughput results from an individual run. We decided to consolidate the results from a complete test run on a single row, highlighting only the maximum number of successful requests (throughout). All the raw data from each run remains available for download on the details page for each result, but visitors don’t have to wade through all that data to find the configuration’s main “score.”

We view the development of the CloudXPRT results viewer as an ongoing process. As we add results and receive feedback from testers about the data presentation formats that work best for them, we’ll continue to add more features and tweak existing ones to make them as useful as possible. If you have any questions about CloudXPRT results or the results viewer, please let us know!

Justin

Check out the other XPRTs:

Forgot your password?