A Principled Technologies report: Hands-on testing. Real-world results.
Undertake intensive projects with an HP Z6 G5 A Desktop Workstation powered by an AMD Ryzen Threadripper PRO 7975WX CPU
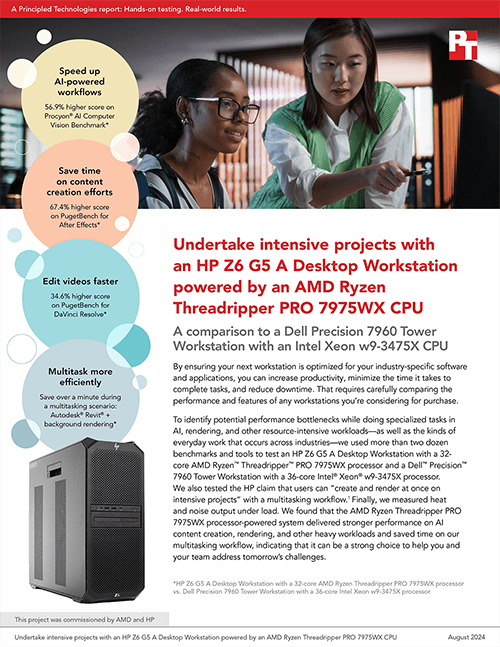
A comparison to a Dell Precision 7960 Tower Workstation with an Intel Xeon w9-3475X CPU
By ensuring your next workstation is optimized for your industry-specific software and applications, you can increase productivity, minimize the time it takes to complete tasks, and reduce downtime. That requires carefully comparing the performance and features of any workstations you’re considering for purchase.
To identify potential performance bottlenecks while doing specialized tasks in AI, rendering, and other resource-intensive workloads—as well as the kinds of everyday work that occurs across industries—we used more than two dozen benchmarks and tools to test an HP Z6 G5 A Desktop Workstation with a 32-core AMD Ryzen™ Threadripper™ PRO 7975WX processor and a Dell™ Precision™ 7960 Tower Workstation with a 36-core Intel® Xeon® w9-3475X processor. We also tested the HP claim that users can “create and render at once on intensive projects” with a multitasking workflow.1Finally, we measured heat and noise output under load. We found that the AMD Ryzen Threadripper PRO 7975WX processor-powered system delivered stronger performance on AI content creation, rendering, and other heavy workloads and saved time on our multitasking workflow, indicating that it can be a strong choice to help you and your team address tomorrow’s challenges.
How we tested
We equipped each workstation with Windows 11 Pro, an NVIDIA® RTX™ 4000 Ada Generation GPU, 128 GB of RAM, and 1 TB of NVMe® storage. For both workstations, we set the Windows Power Mode to “Best Performance”. For the HP Z6 G5 A workstation, we set the power plan to “HP Optimized” and the BIOS performance control setting to “Performance”. For the Dell Precision 7960 workstation, we set the powerplan to “Best Performance” and the BIOS thermal management setting to“Optimized”.
We assessed the systems’ performance using 24 different tools and benchmarks. Some of our testing approaches quantified performance for AI workloads, content creation tasks, or heavy visual workloads such as image rendering, while others focused on everyday productivity.
3DMark
Blender
Chaos® V-Ray® benchmark
Cinebench 2024
Geekbench ML
KeyShot® Benchmark
Maxon redshiftBenchmark
Metashape Pro tasks
MLPerf ResNet-50 inferencing benchmark
PassMark PerformanceTest 11
Procyon AI Computer Vision Benchmark
Procyon Office Productivity Benchmark
Procyon Photo Editing Benchmark
Procyon Video Editing Benchmark
PugetBench for After Effects
PugetBench for DaVinci Resolve
PugetBench for Premiere Pro
Revit 2024.1 RFO benchmark
SPECapc® for Creo 9
SPECapc for Maya 2024
SPECapc for Solidworks 2024
SPECviewperf® 2020 v3.1
SPECworkstation® 3.1
Unreal Engine project compilation
To find out whether we could “create and render at once on intensive projects,” as HP claims, we also hand-timed a multitasking workflow where we used Autodesk Revit modeling and Autodesk Maya rendering tools simultaneously.2 Finally, to determine heat and noise output under load, we took thermal and acoustic readings on both workstations while they ran the Cinebench 2024 benchmark for 90 minutes.
The results we report reflect the specific configurations we tested. Any difference in the configurations—as well as screen brightness, network traffic, and software additions—can affect these results. For a deeper dive into our testing parameters and procedures, see the science behind the report.
About the HP Z6 G5 A Desktop Workstation
Performance
The HP Z6 G5 A Desktop Workstation is designed to power demanding 3D rendering, AI/machine learning, and virtual production workloads. This powerhouse can support up to 96 cores in a single AMD Ryzen Threadripper PRO 7000 WX-series CPU, up to three GPUs, and up to 1 TB of DDR5 ECC memory.3 The HP Z6 G5 A Desktop Workstation is, according to HP, designed for maximum storage with the ability to “expand with a Z Turbo Quad Pro card, 4 onboard, tool-less M.2 connections and 4 front accessible, hot-swappable NVMe bays.”4
Connectivity
Configuration options for the HP Z6 G5 A include the following ports:
Whether your workdays are filled with problem solving, tackling complex AI or machine learning projects, or modeling and manipulating designs in 3D, you need to consider a number of factors before investing in a new workstation. The system must support the applications you use and have enough ports for your accessories. High-end processors and graphics cards can generate a lot of heat, and the fans used to cool these components can be noisy, so it’s important to find out whether the system can remain cool and quiet enough. And above all, the system has to deliver the performance you need.
We focused our testing mostly on CPU capabilities—but we recognize that CPU, GPU, RAM, and storage all play a role in the overarching performance picture. We equipped both workstations with identical NVIDIA RTX 4000 Ada Generation GPUs and enough RAM and SSD storage to power our tests.
About the AMD Ryzen Threadripper PRO 7975WX processor
The next-gen AMD Ryzen Threadripper PRO 7975WX processor is built on Zen 4 architecture to “enable artists, architects, and engineers with the ability to get more done in less time.”8 This Ryzen Threadripper PRO 7000 Series WX processor has 32 cores, 64 threads, and a core frequency between 4.0 – 5.3 GHz.9
Handle heavy workloads with ease, from AI to rendering
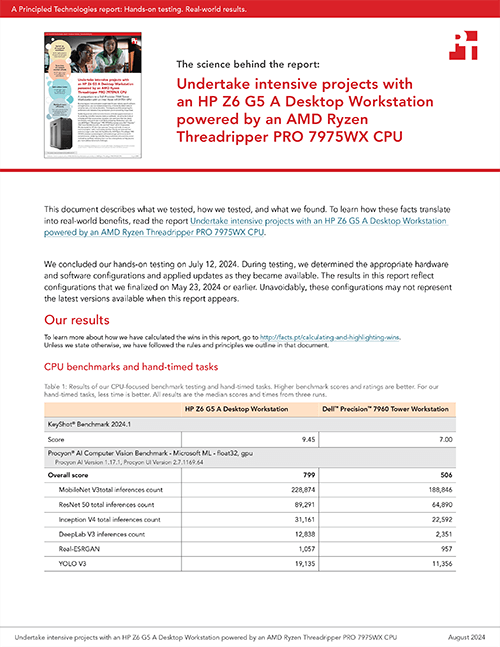
AI is a major focus of the tech world in 2024, and if you’re selecting workstations for teams who might rely on AI applications—whether as developers or creators—AI performance must be a consideration. The ResNet-50 inferencing benchmark measures image recognition and classification capabilities; this work happens largely in the GPU. Given that both workstations contained identical NVIDIA RTX 4000 Ada Generation GPUs, we weren’t surprised to see that the results were almost the same, but the HP Z6 G5 A Desktop Workstation with a 32-core AMD Ryzen Threadripper PRO 7975WX processor still did slightly better.
The HP Z6 G5 A Desktop Workstation had a more pronounced advantage when we measured performance with the Procyon AI Computer Vision Benchmark, which uses a variety of inference engines to gauge AI/machine learning application performance.10 We also saw a big difference with the DirectML workload of the Geekbench ML Inference Open Neural Network Exchange (ONNX) model, which evaluates computer vision and natural language processing (NLP) tasks.11 On these benchmarks, the AMD Ryzen Threadripper PRO 7975WX processor-powered workstation delivered over 50 percent higher AI performance than the Intel Xeon w9-3475X processor-powered system.
Note: The graphs in this report use different scales to keep a consistent size. Please be mindful of each graph’s data range as you compare.
Procyon AI Computer Vision Benchmark results. Higher is better. Source: Principled Technologies.
Geekbench ML ONNX DirectML inference scores. Higher is better. Source: Principled Technologies.
MLPerf ResNet-50 benchmark results. Higher is better. Source: Principled Technologies.
We next assessed the systems’ general performance using PassMark PerformanceTest 11, which combines CPU, 2D and 3D graphics, storage, and memory test performance metrics into an overall PassMark rating.12We also ran the Procyon Office Productivity Benchmark, which mimics common productivity tasks and usage patterns using Microsoft 365 applications.13 The HP Z6 G5 A Desktop Workstation with a 32-core AMD Ryzen Threadripper PRO 7975WX processor performed significantly better on these benchmarks than the Dell Precision 7960 Tower Workstation with a 36-core Intel Xeon w9-3475X processor.
PassMark Performance Test 11 benchmark results. Higher is better. Source: Principled Technologies.
The AMD Ryzen Threadripper PRO 7975WX processor-powered HP Z6 G5 A also received higher scores in our 3DMark and SPECworkstation 3.1 benchmark tests. 3DMark scans a system’s hardware and estimates the frame rates you can expect from that hardware when using resource- and graphic-intensive games.14We tried two different tests: Fire Strike Extreme and Time Spy Extreme. SPECworkstation 3.1 measures CPU, GPU, I/O, and memory bandwidth performance using real-world media and entertainment, product development, life sciences, financial services, energy, and general operations workloads.15
3DMark Fire Strike Extreme and Time Spy Extreme benchmark scores. Higher is better. Source: Principled Technologies.
SPECworkstation 3.1 benchmark results. Higher is better. Source: Principled Technologies.
Save time on compute-intensive content creation work
Marking agencies have utilized photo and video editing software for decades, but with 77 percent of businesses connecting with customers via social media, many organizations may see the need to create their own photo and video content.16 The files and applications involved can require a great deal of compute power, so you need a powerful system to be able to work smoothly. In our content creation tests, the HP Z6 G5 A Desktop Workstation with a 32-core AMD Ryzen Threadripper PRO 7975WX processor received universally higher benchmark scores than the Dell Precision 7960 Tower Workstation with a 36-core Intel Xeon w9-3475X processor.
To quantify performance for real-world photo and video tasks, we tested with the Procyon Photo Editing, Procyon Video Editing, PugetBench for After Effects, and PugetBench for Premiere Pro benchmarks, all of which use Adobe® Creative Cloud® applications to measure typical content creation workflows. SPECviewperf 2020 v3.1, which measures OpenGL and DirectX 3D graphics performance, gave us another angle on how the systems might perform on graphics-heavy workloads.17Finally, we tested with SPECapc for Maya 2023 to highlight performance for users who rely on Autodesk Maya software. This benchmark runs 47 animation and visual effects tests using 11 separate models and animations to get a full picture of Autodesk Maya performance.18See the science behind the report for a complete list of results.
SPECapc for Maya 2023 benchmark results. Higher is better. Source: Principled Technologies.
Render complex scenes faster
Rendering 3D objects and scenes is an extremely compute-intensive task, and time savings in this area can have real impact on a project’s success. In our rendering tests, we saw consistent improvements from the HP Z6 G5 A Desktop Workstation with a 32-core AMD Ryzen Threadripper PRO 7975WX processor compared to the Dell Precision 7960 Tower Workstation with a 36-core Intel Xeon w9-3475X processor. Even with the same NVIDIA RTX 4000 Ada Generation GPU as its competitor, the HP workstation received a higher GPU score on the Cinebench 2024 benchmark.
Because many different popular rendering applications are available, each of the benchmarks we used in these tests takes a different approach to measuring rendering performance. The Chaos V-Ray benchmark measures rendering speed using RTX and CUDA-based V-Ray 6 render engines.19 We ran three workloads from Blender—The Junk Shop, Monster, and Classroom—to measure 3D splash rendering, EEVEE real-time rendering, and Cycles rendering, respectively.20
Chaos V-Ray benchmark results. Higher is better. Source: Principled Technologies.
Blender benchmark results for Monster, The Junk Shop, and Classroom workloads. Higher is better. Source: Principled Technologies.
We tested each workstation with two benchmarks based on the Redshift rendering engine. First, we ran Cinebench 2024, which uses that engine to evaluate a system’s CPU and GPU capabilities.21 Then we ran Maxon redshiftBenchmark command-line tool, which enabled us to measure how long each workstation took to load and render a scene.22 The KeyShotBenchmark measures CPU rendering performance using the KeyShot application, which calls itself “the #1 3D rendering tool for photorealistic quality and ease of use.”23 The PugetBench for DaVinci Resolve CPU benchmark measures a variety of video-editing capabilities within DaVinci, including encoding, processing, and GPU effects.24
Cinebench 2024 results. Higher is better. Source: Principled Technologies.
Time to render a scene using the Maxon redshiftBenchmark tool. Lower is better. Source: Principled Technologies.
KeyShot Benchmark results. Higher is better. Source: Principled Technologies.
PugetBench for DaVinci Resolve benchmark results. Higher is better. Source: Principled Technologies.
Finally, we pivoted from the creative field and tested performance for applications used by architects, city planners, and scientists. Agisoft Metashape Pro is a geographic information system (GIS) tool used for photogrammetry.25 For this comparison, we hand-timed how long it took each workstation to align photos, build a cloud point, build a mesh, and build texture. Revit 2024.1 RFO measures high-quality image rendering performance on Autodesk Revit, a type of building information modeling (BIM) software.
Metashape Pro align photos, build point cloud, build mesh, and build texture total task completion times. Less time is better. Source: Principled Technologies.
We also hand-timed a multitasking workflow where we used Autodesk Revit modeling and Autodesk Maya rendering tools simultaneously (see the science behind the report for more details). The HP Z6 G5 A Desktop Workstation with an AMD Ryzen Threadripper PRO 7975WX processor saved over a minute on the Revit task and 44 seconds on the Maya task compared to the Dell Precision 7960 Tower Workstation with an Intel Xeon w9-3475X processor. If you’re dealing with large scenes or completing these rendering tasks multiple times a day, those time savings really add up.
Hand-timed Revit and Maya multitasking workflow. Lower is better. Source: Principled Technologies.
Speed your engineering, drafting, and design projects
High-powered workstations are a necessity for engineers, architects, scientists, and game designers working with large renders and models in computer-aided design (CAD) software. The faster their workstations, the more work they can accomplish in a day. In our engineering, drafting, and design tests, the AMD Ryzen Threadripper PRO 7975WX processor-powered HP Z6 G5 A Desktop Workstation received higher benchmark scores than the Intel Xeon w9-3475X processor-powered Dell Precision 7960 Tower Workstation on all three benchmarks.
Here again, we tested using two different CAD applications to get a broad look at performance. SPECapc for Creo 9 includes three CPU workflows and five GPU workflows using Creo 9 CAD software.26 And SPECapc for SolidWorks 2024, which includes 10 models and 60 tests to measure graphics and CPU functionality, uses the popular CAD program SolidWorks.27
SPECapc for Creo 9 benchmark results. Higher is better. Source: Principled Technologies.
SPECapc for SolidWorks 2024 benchmark results. Higher is better. Source: Principled Technologies.
We also ran three different build tasks in Unreal Engine—one for gaming, one for architecture, and one for video production—and timed how long they took to complete on both systems. The AMD Ryzen Threadripper PRO 7975WX processor-powered HP Z6 G5 A Desktop Workstation saved up to 8 seconds compared to the competition.
Achieve better graphics performance with minimal extra noise and heat
Workstations are powerful, but they can also generate a lot of heat and sound. Storing your workstation under your desk instead of on top of it can muffle its noise a bit and make it less likely that you’ll brush against it. However, it’s still important to minimize noise and heat.
To see what kind of thermals and acoustics the systems output while under a heavy load, we ran the compute-intensive multi-core Cinebench 2024 workload on both workstations for a 60-minute warmup period. Then, over the next 30 minutes, with the workload still running, we measured the average decibel level the systems emitted and the average temperature at several spots on the devices: the power supply unit (PSU), the top of the chassis, the front of the chassis, and the rear fan CPU exhaust.
Similar to what we saw in our earlier Cinebench testing, the AMD Ryzen Threadripper PRO 7975WX processor-powered HP Z6 G5 A Desktop Workstation performed significantly better on this benchmark than the Intel Xeon w9-3475X processor-powered Dell Precision 7960 Tower Workstation. And it achieved the higher score without throwing off a lot of additional heat or noise. In fact, the HP Z6 G5 A Desktop Workstation powered by an AMD Threadripper PRO 7975WX processor was slightly cooler than the Dell Precision 7960 Workstation powered by an Intel Xeon w9-3475WX processor in three of our four comparisons—and the chassis top was only slightly warmer than that of its competition. And, while the Z6 G5 A Desktop Workstation was just over 3 decibels louder than the Dell Precision 7930 Tower Workstation, they were both still a little quieter than a standard office space.28If you can get faster renders with comparable thermal levels and a small increase in noise output, that might be a valuable tradeoff.
Cinebench 2024 results during a sustained 90-minute test. Higher is better. Source: Principled Technologies
Thermal testing results, with temperatures in °F. Lower is better. Source: Principled Technologies
Acoustic testing results, with sound in decibels. Lower is better. Source: Principled Technologies.
Conclusion
Whether your field is architecture, video production, or game design, you need a powerful system to execute your heavy AI and rendering tasks. In a host of tests with resource-intensive benchmarks and workloads, we saw that the HP Z6 G5 A Desktop Workstation with a 32-core AMD Ryzen Threadripper PRO 7975WX processor offered performance advantages over the Dell Precision 7960 Tower Workstation with a 36-core Intel Xeon w9-3475X processor, despite the fact that both workstations contained identical NVIDIA RTX 4000 Ada Generation GPUs. When you’re making your next workstation purchase, consider which system will best serve your performance needs.
Principled Technologies is a registered trademark of Principled Technologies, Inc.
All other product names are the trademarks of their respective owners.
Principled Technologies disclaimer
Principled Technologies is a registered trademark of Principled Technologies, Inc. All other product names are the trademarks of their respective owners.
DISCLAIMER OF WARRANTIES; LIMITATION OF LIABILITY: Principled Technologies, Inc. has made reasonable efforts to ensure the accuracy and validity of its testing, however, Principled Technologies, Inc. specifically disclaims any warranty, expressed or implied, relating to the test results and analysis, their accuracy, completeness or quality, including any implied warranty of fitness for any particular purpose. All persons or entities relying on the results of any testing do so at their own risk, and agree that Principled Technologies, Inc., its employees and its subcontractors shall have no liability whatsoever from any claim of loss or damage on account of any alleged error or defect in any testing procedure or result.
In no event shall Principled Technologies, Inc. be liable for indirect, special, incidental, or consequential damages in connection with its testing, even if advised of the possibility of such damages. In no event shall Principled Technologies, Inc.’s liability, including for direct damages, exceed the amounts paid in connection with Principled Technologies, Inc.’s testing. Customer’s sole and exclusive remedies are as set forth herein.


 Twitter
 Facebook
 LinkedIn
 Email
Email